The 2020 Sacramento Heat Waves: What Happened and What the Future Holds
It was mid-August 2020 in Sacramento. COVID-19 lockdowns were long in place, and the region was already deep into a stretch of summer heat. On August 14th, that heat would escalate drastically.
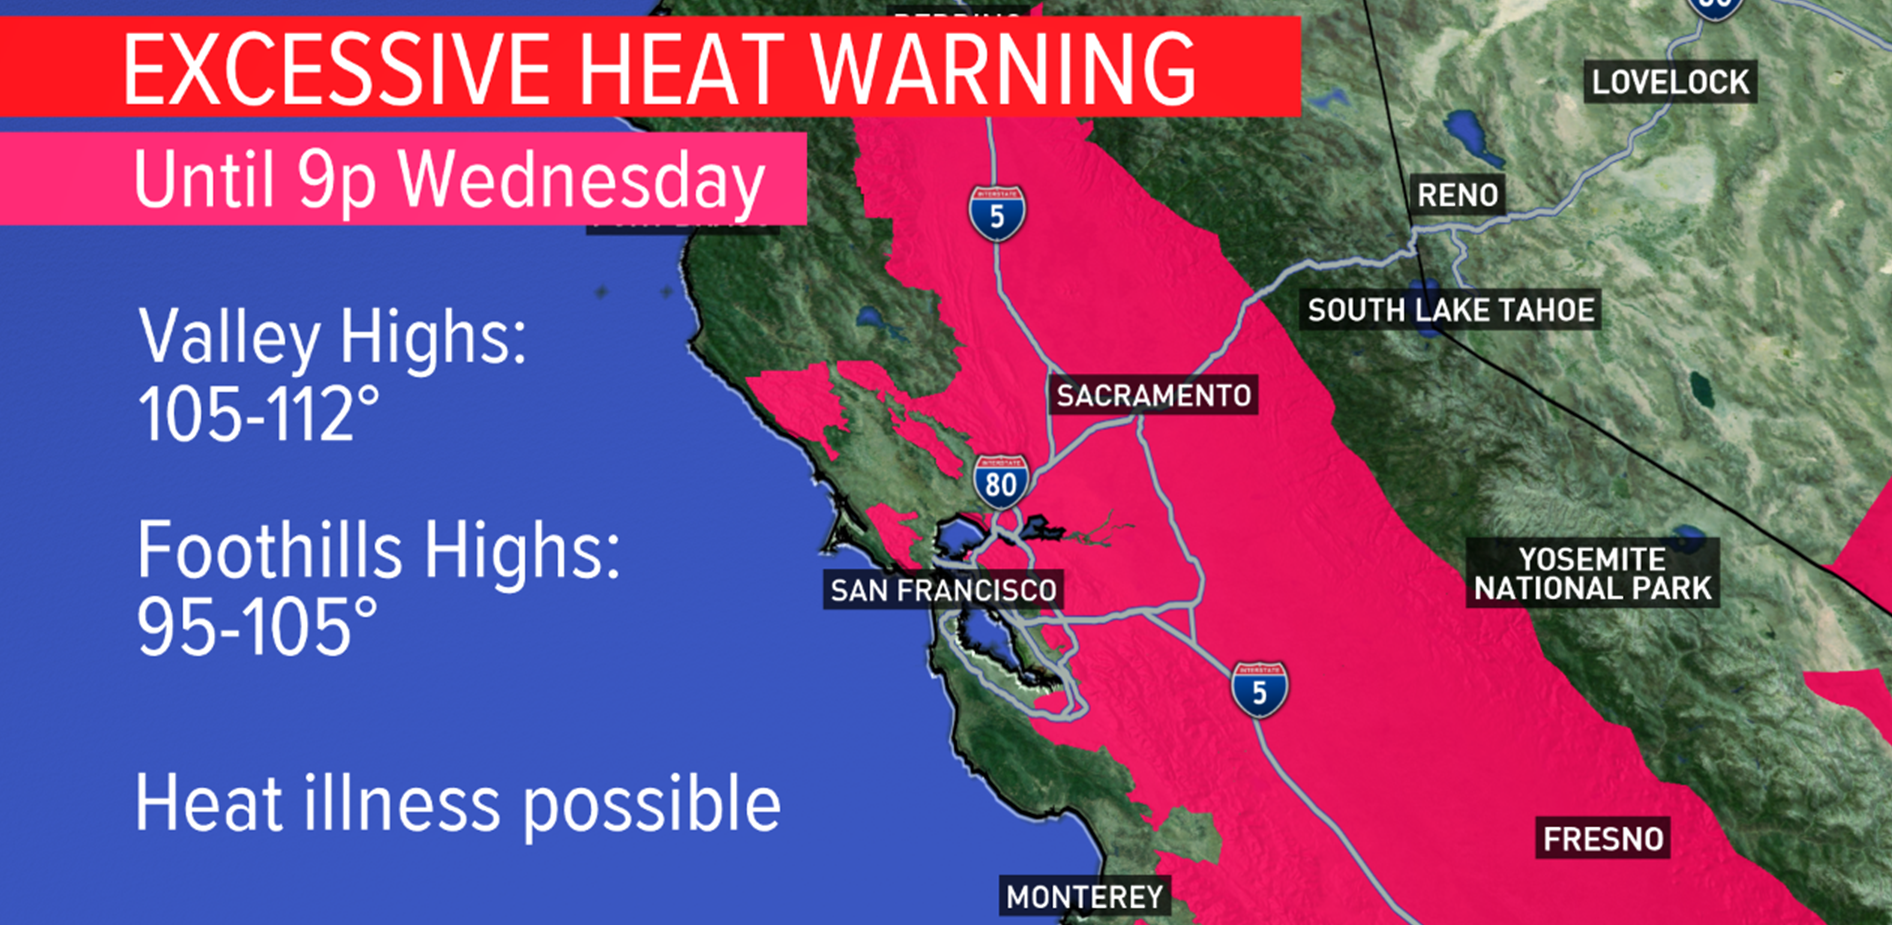
By 6 a.m., as the city began to wake up, the temperature in Sacramento climbed past 80°F. Morning news warned of the potential for an excessively hot day (Figure 1). By 7 a.m., an estimated 1.6 million people across Sacramento County were already under an extreme heat warning. In neighborhoods like Del Paso Heights, Meadowview, and Oak Park, which are considered heat vulnerable1, sparse tree canopy left streets and homes exposed to direct sun with little shade relief. As the temperature shot past 100°F and stayed near 106°F from 2 p.m. to 9 p.m., residents had begun enduring only the beginning of what would end up being one of the most impactful heat waves to hit Sacramento.
These historic heat waves dominated California’s weather patterns and news streams throughout August and September of 2020. Typically, the Delta breeze2, which is a sea breeze that passes through the Bay Area eastward towards the Central Valley, moderates temperatures and brings much needed relief to Sacramento County, especially during the night. However, this breeze was weakened by an exceptionally strong and persistent ridge of high pressure across the Western U.S., leaving California’s Central Valley without its natural nighttime cooling mechanism.
By the evening of August 14th, the California Independent System Operator (CAISO) declared a grid emergency as cooling demand pushed electricity load beyond what the system could supply. For the first time since 2001, CAISO implemented rolling blackouts in order to prevent catastrophic grid failures and more widespread and uncontrolled blackouts across the region. However, the impact of these rolling blackouts were substantial, more than 300,000 Californains were without power at the precise time they needed it the most to remain safe during the heat wave.
We will explore the intensity of the 2020 Sacramento heat wave in greater detail, and examine how events like this are likely to change in frequency under a future warming climate. The August and September heatwaves were more than just long, hot days and nights: they strained the energy grid to its limits and put lives at risk. Understanding the physical drivers of heat waves and the socioeconomic factors that determine who experiences the worst impacts is essential for building a more resilient grid and a safer and equitable future.
About This Analysis
This analysis was produced by the Cal-Adapt Team, led by Eagle Rock Analytics, a climate data and analytics firm based in Sacramento. Cal-Adapt builds tools and pipelines that help California utilities, planners, and public agencies understand how climate hazards are changing, and what that means for the communities they serve.
When an extreme event like this occurs, we think it’s worth going beyond the headlines: not just describing what happened but grounding it in data. The analysis draws on publicly available climate datasets, including gridded historical observations and downscaled future projections hosted by Cal-Adapt.org.
Disclaimer: This post is intended for informational and educational purposes to illustrate historical and projected climate hazards. It is not a comprehensive assessment, or a substitute for any hazard mitigation planning. To see the site’s full disclaimer on how to interpret and apply this material, please review our full disclaimer for more information.
3 Key Messages
This event was historically exceptional. The 2020 heat waves pushed Sacramento’s temperatures above 105°F, the National Weather Service extreme danger threshold, making them among the most intense in the observed record at the Sacramento Executive Airport weather station (KSAC) since 19803.
Events like this are likely to become more likely. By mid-century, heat wave events similar to the one felt in Sacramento are expected to occur 3 times more frequently than they did in the recent past (Figure 4).
There are tools and plans to act. Sacramento County already has hazard mitigation plans, cooling infrastructure, and urban forestry programs in place. The data we explore can help identify where those investments should be scaled and where new investments are urgently needed.
How Was This Event Defined?
It is important to use a consistent and reproducible definition of climate hazards when performing an event analysis. For this analysis, we used the criteria applied by the Office of Emergency Services to formally classify extreme heat events3:
- Duration: Maximum temperature exceeding 105°F for more than 3 consecutive days
- Daytime threshold: Maximum temperature at or above 105°F
- Nighttime threshold: Minimum temperature at or above 75°F
- Spatial extent: Sacramento metropolitan area, anchored to KSAC (Sacramento Executive Airport, station ID
ASOSAWOS_72483023232)
How Bad Was This Event, Historically?
Where 2020 Ranks
Figure 2 shows the annual mean temperature anomaly, the deviation from what is considered normal, at the KSAC weather station (the Sacramento Executive Airport). Red bars indicate that hourly temperatures averaged across the year were warmer than usual for that year. Blue bars indicate that temperatures were cooler than usual. 2020 is outlined in yellow.
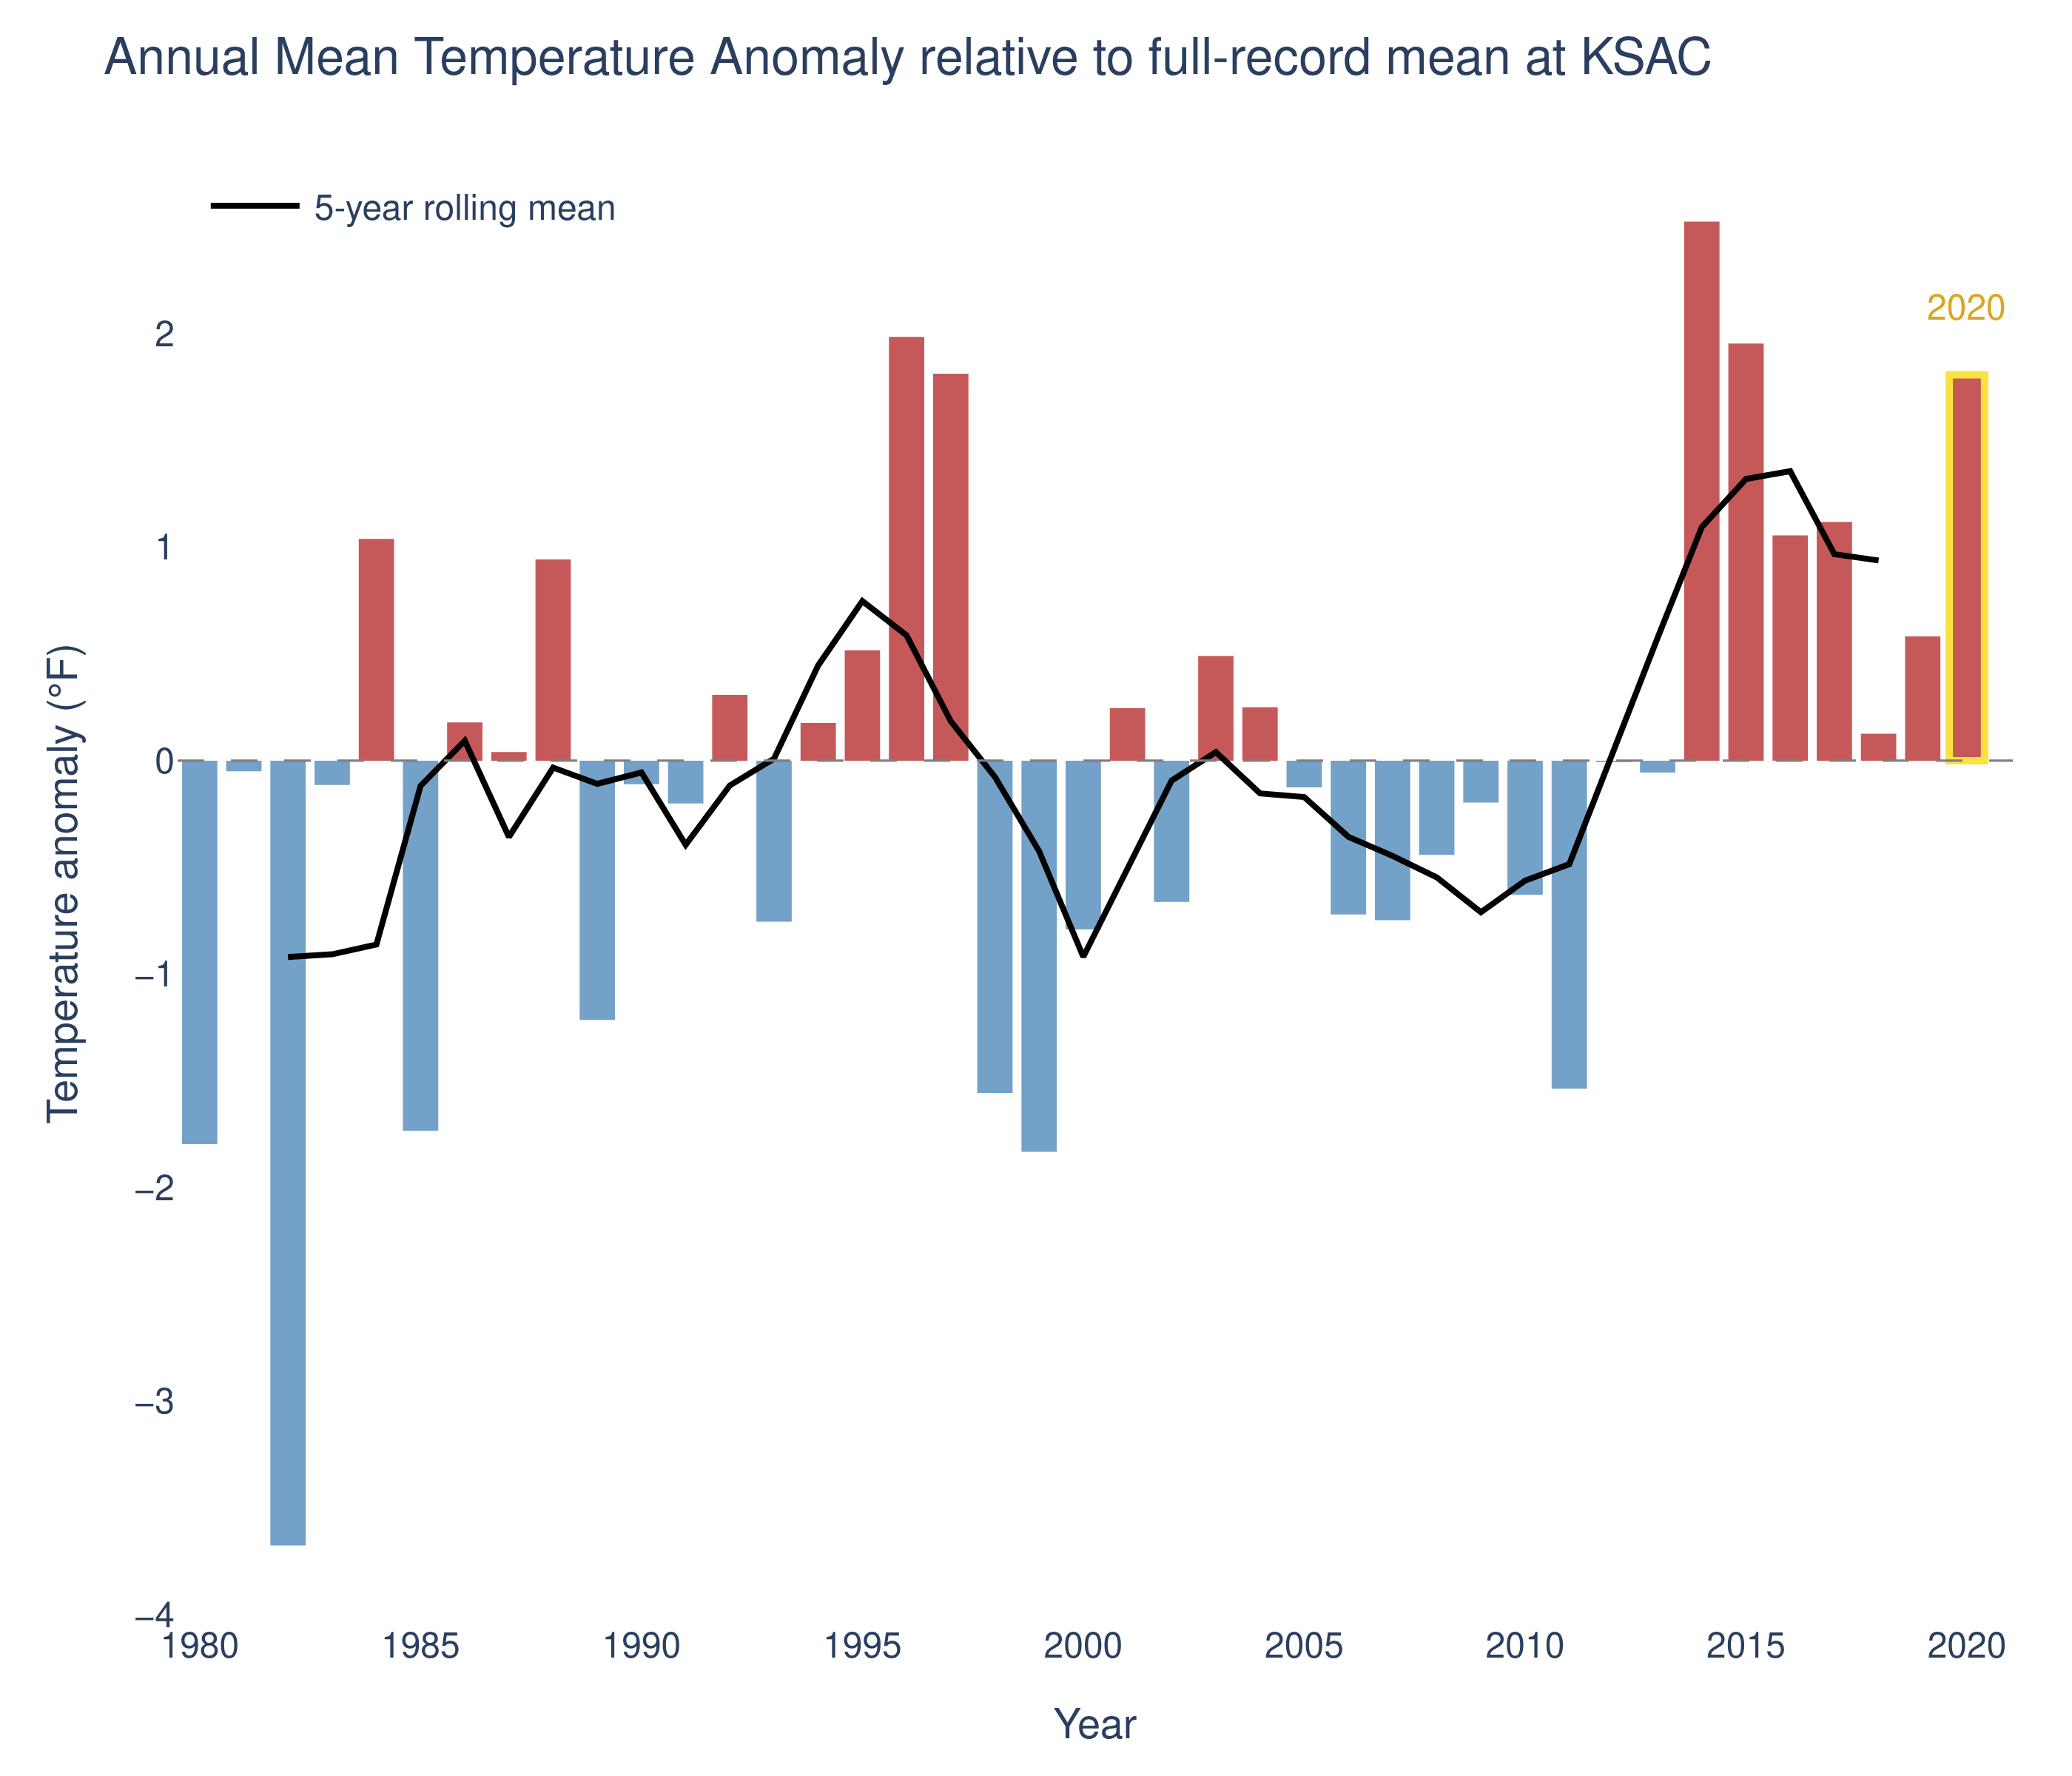
2020 was a hot year, but not necessarily the hottest year on record. So why was this event so impactful? Let’s take a closer look at the historical record.
A closer look at the 2020 heat wave
Figure 3 shows daily maximum (red) and minimum (blue) temperatures for every 5 years on record. The bold lines represent 2020. The two heat waves are shaded as vertical bars in the plot. Hover over any line to see the year, date, and recorded daily max/min temperature for that date.
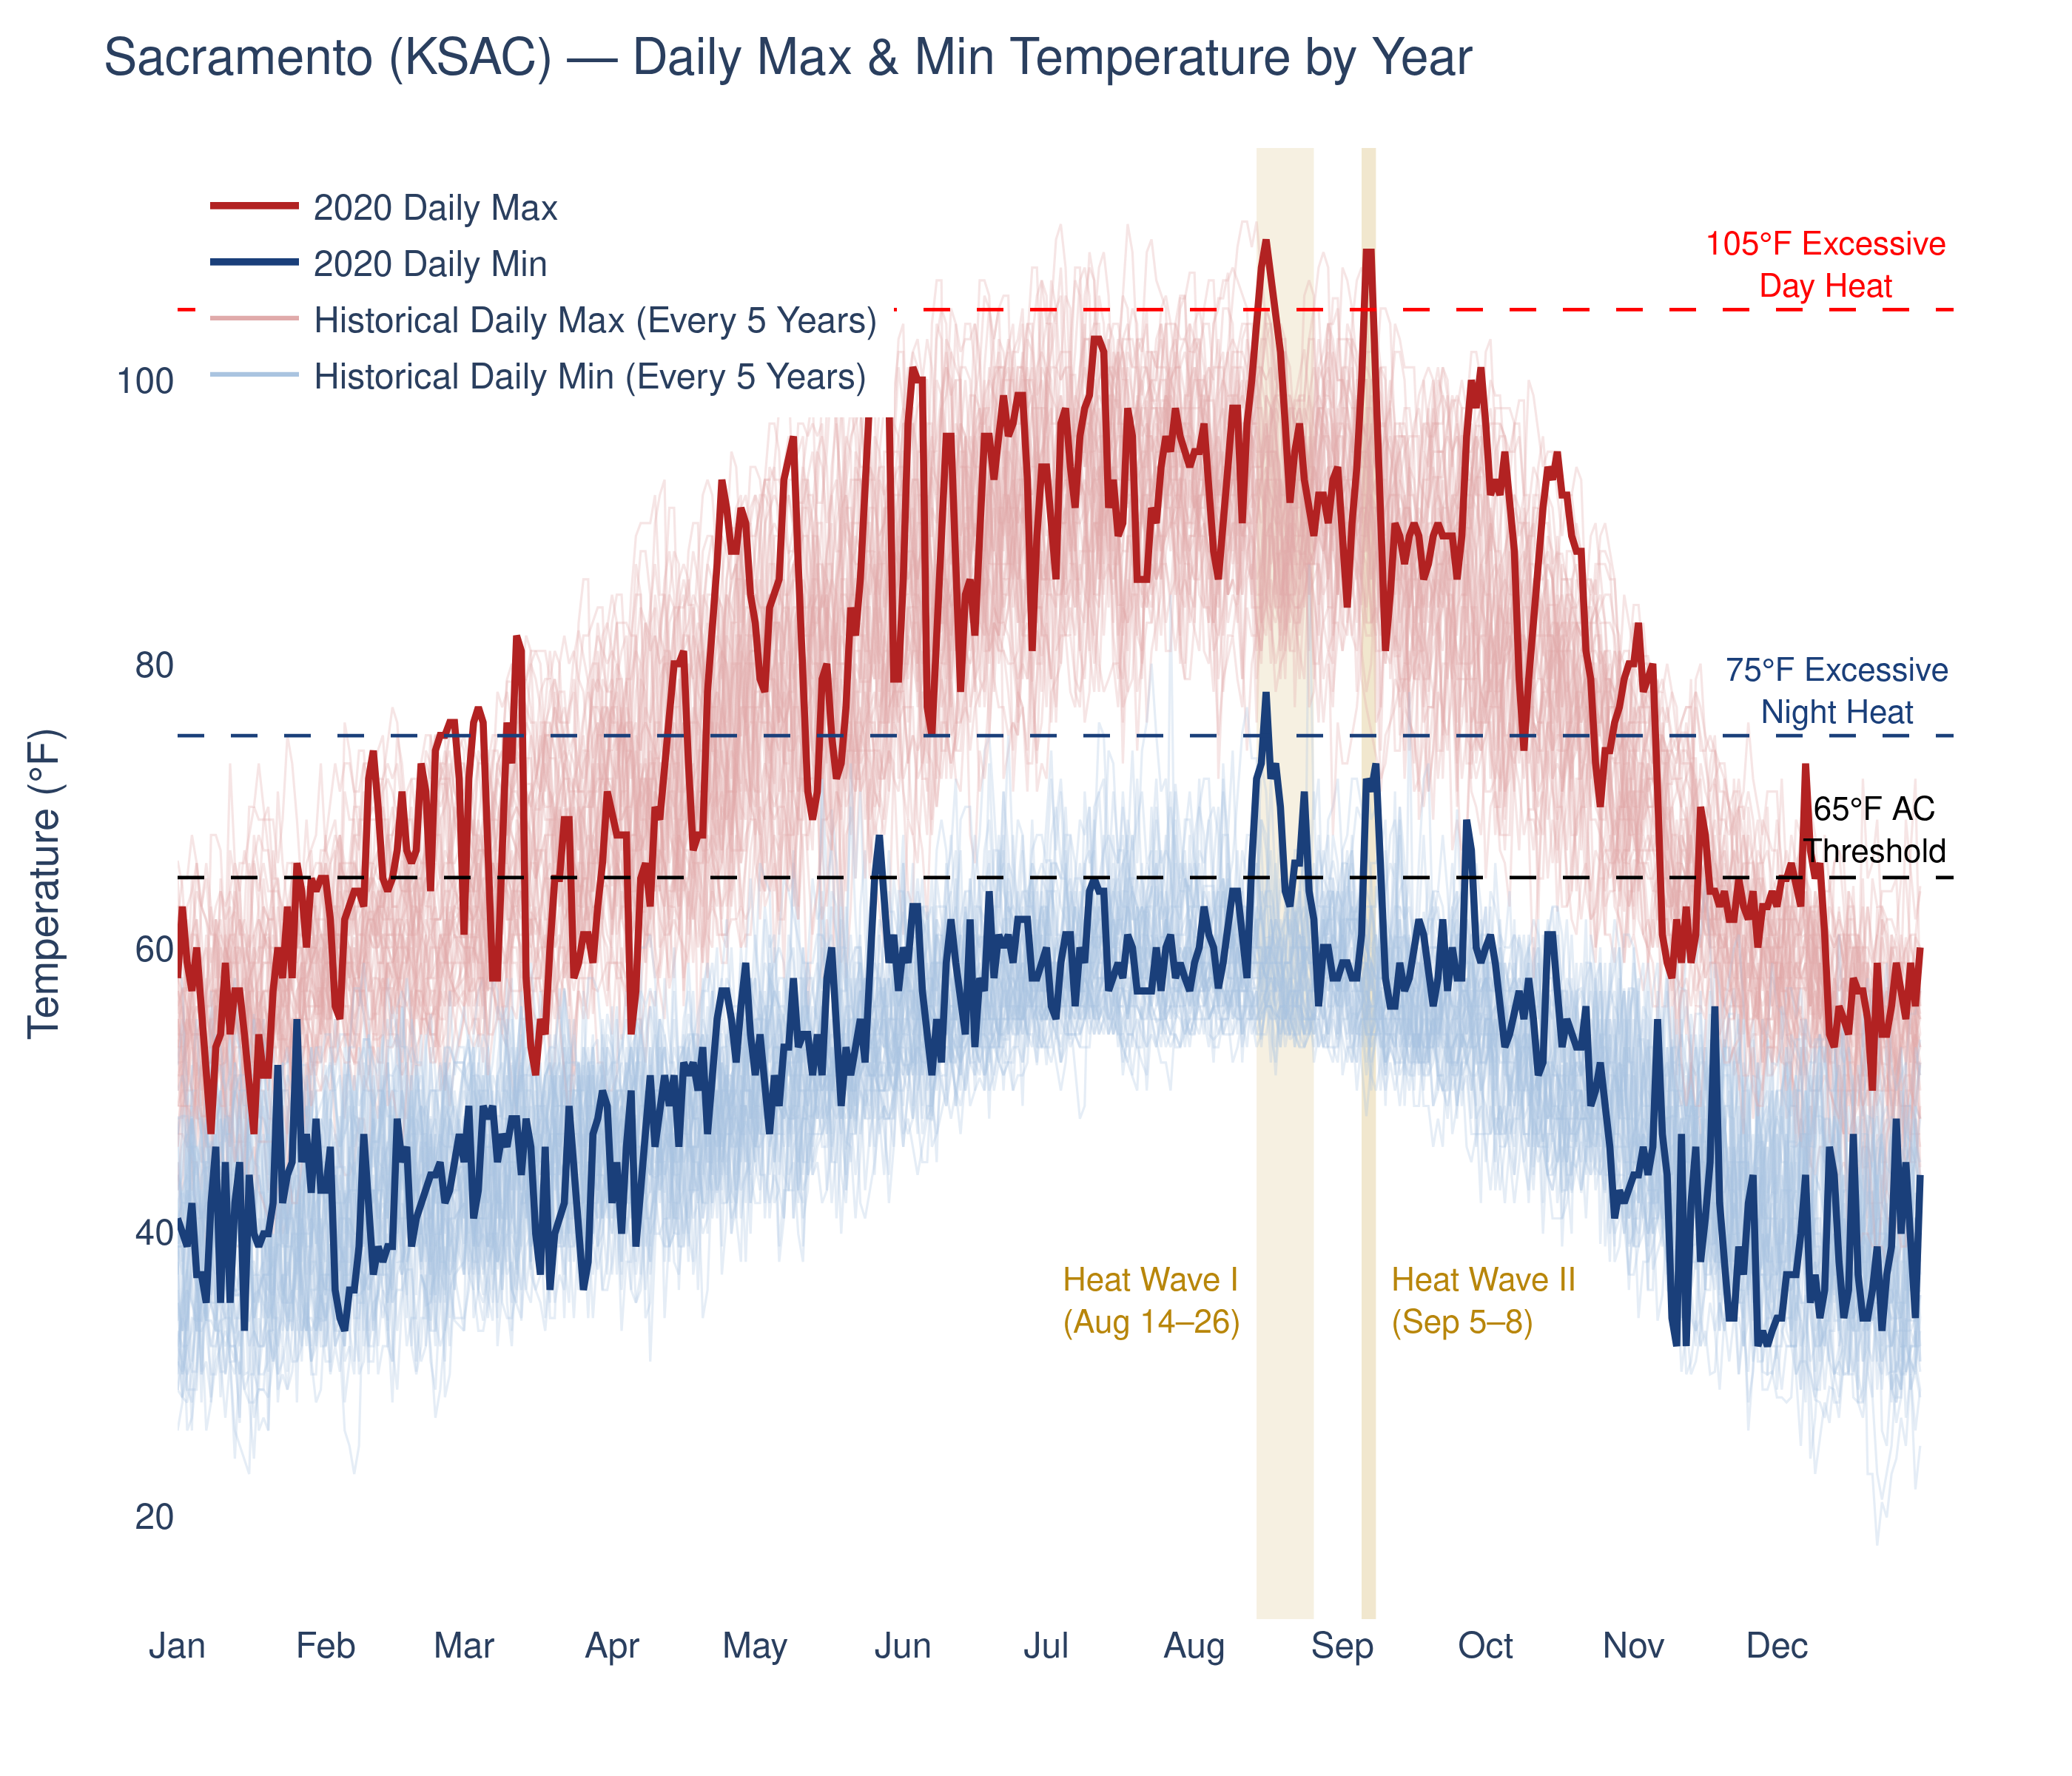
The data clearly shows the peak of the two heat waves, but what stands out is the nighttime temperature (i.e. the historical daily minimum temperatures). There was no overnight relief, resulting in continuous energy demand and creating dangerous conditions for residents of the region. But how unusual was this extreme heat event, and how frequently could these events occur in the future? Let’s take a look into the data and see.
How frequently has this event occurred in the past and how will that change under a warming climate?
Across the 40-year historical period analyzed, only 8 days had both a daily maximum temperature above 105°F and an overnight low at or above 75°F simultaneously, placing an event like this in the 99.9th percentile of all days on record.
Table 1: The 2020 event by the numbers
| Heat Wave I (Aug 14–26) | Heat Wave II (Sep 5–8) | |
|---|---|---|
| Peak max temperature | 109.9°F | 109.0°F |
| Daily max temperature > 105°F | 5 | 2 |
| Nighttime min temperature ≥ 75°F | 1 | 0 |
The data shows that the likelihood of a day like this is extremely low in the historical record, but how might that change under a warming climate?
California has invested in developing state-of-the-art climate projections to help build towards a more resilient future, and these projections, hosted on Cal-Adapt, are a part of the state’s Fifth Climate Change Assessment. Using these climate projections, we can estimate how frequently heat events – like the 2020 heat wave – are likely to occur as the climate warms. For more information specific to the climate projections, check out our guidance page, About Climate Projections and Models.
Next, we’ll take a look at the projections data in terms of their return period, which is a common way to express the frequency of extreme events. Here, we define the return period as the average time between events of a given magnitude. For example, a 100-year flood has a return period of 100 years, meaning that on average, such a flood is expected to occur once every 100 years.
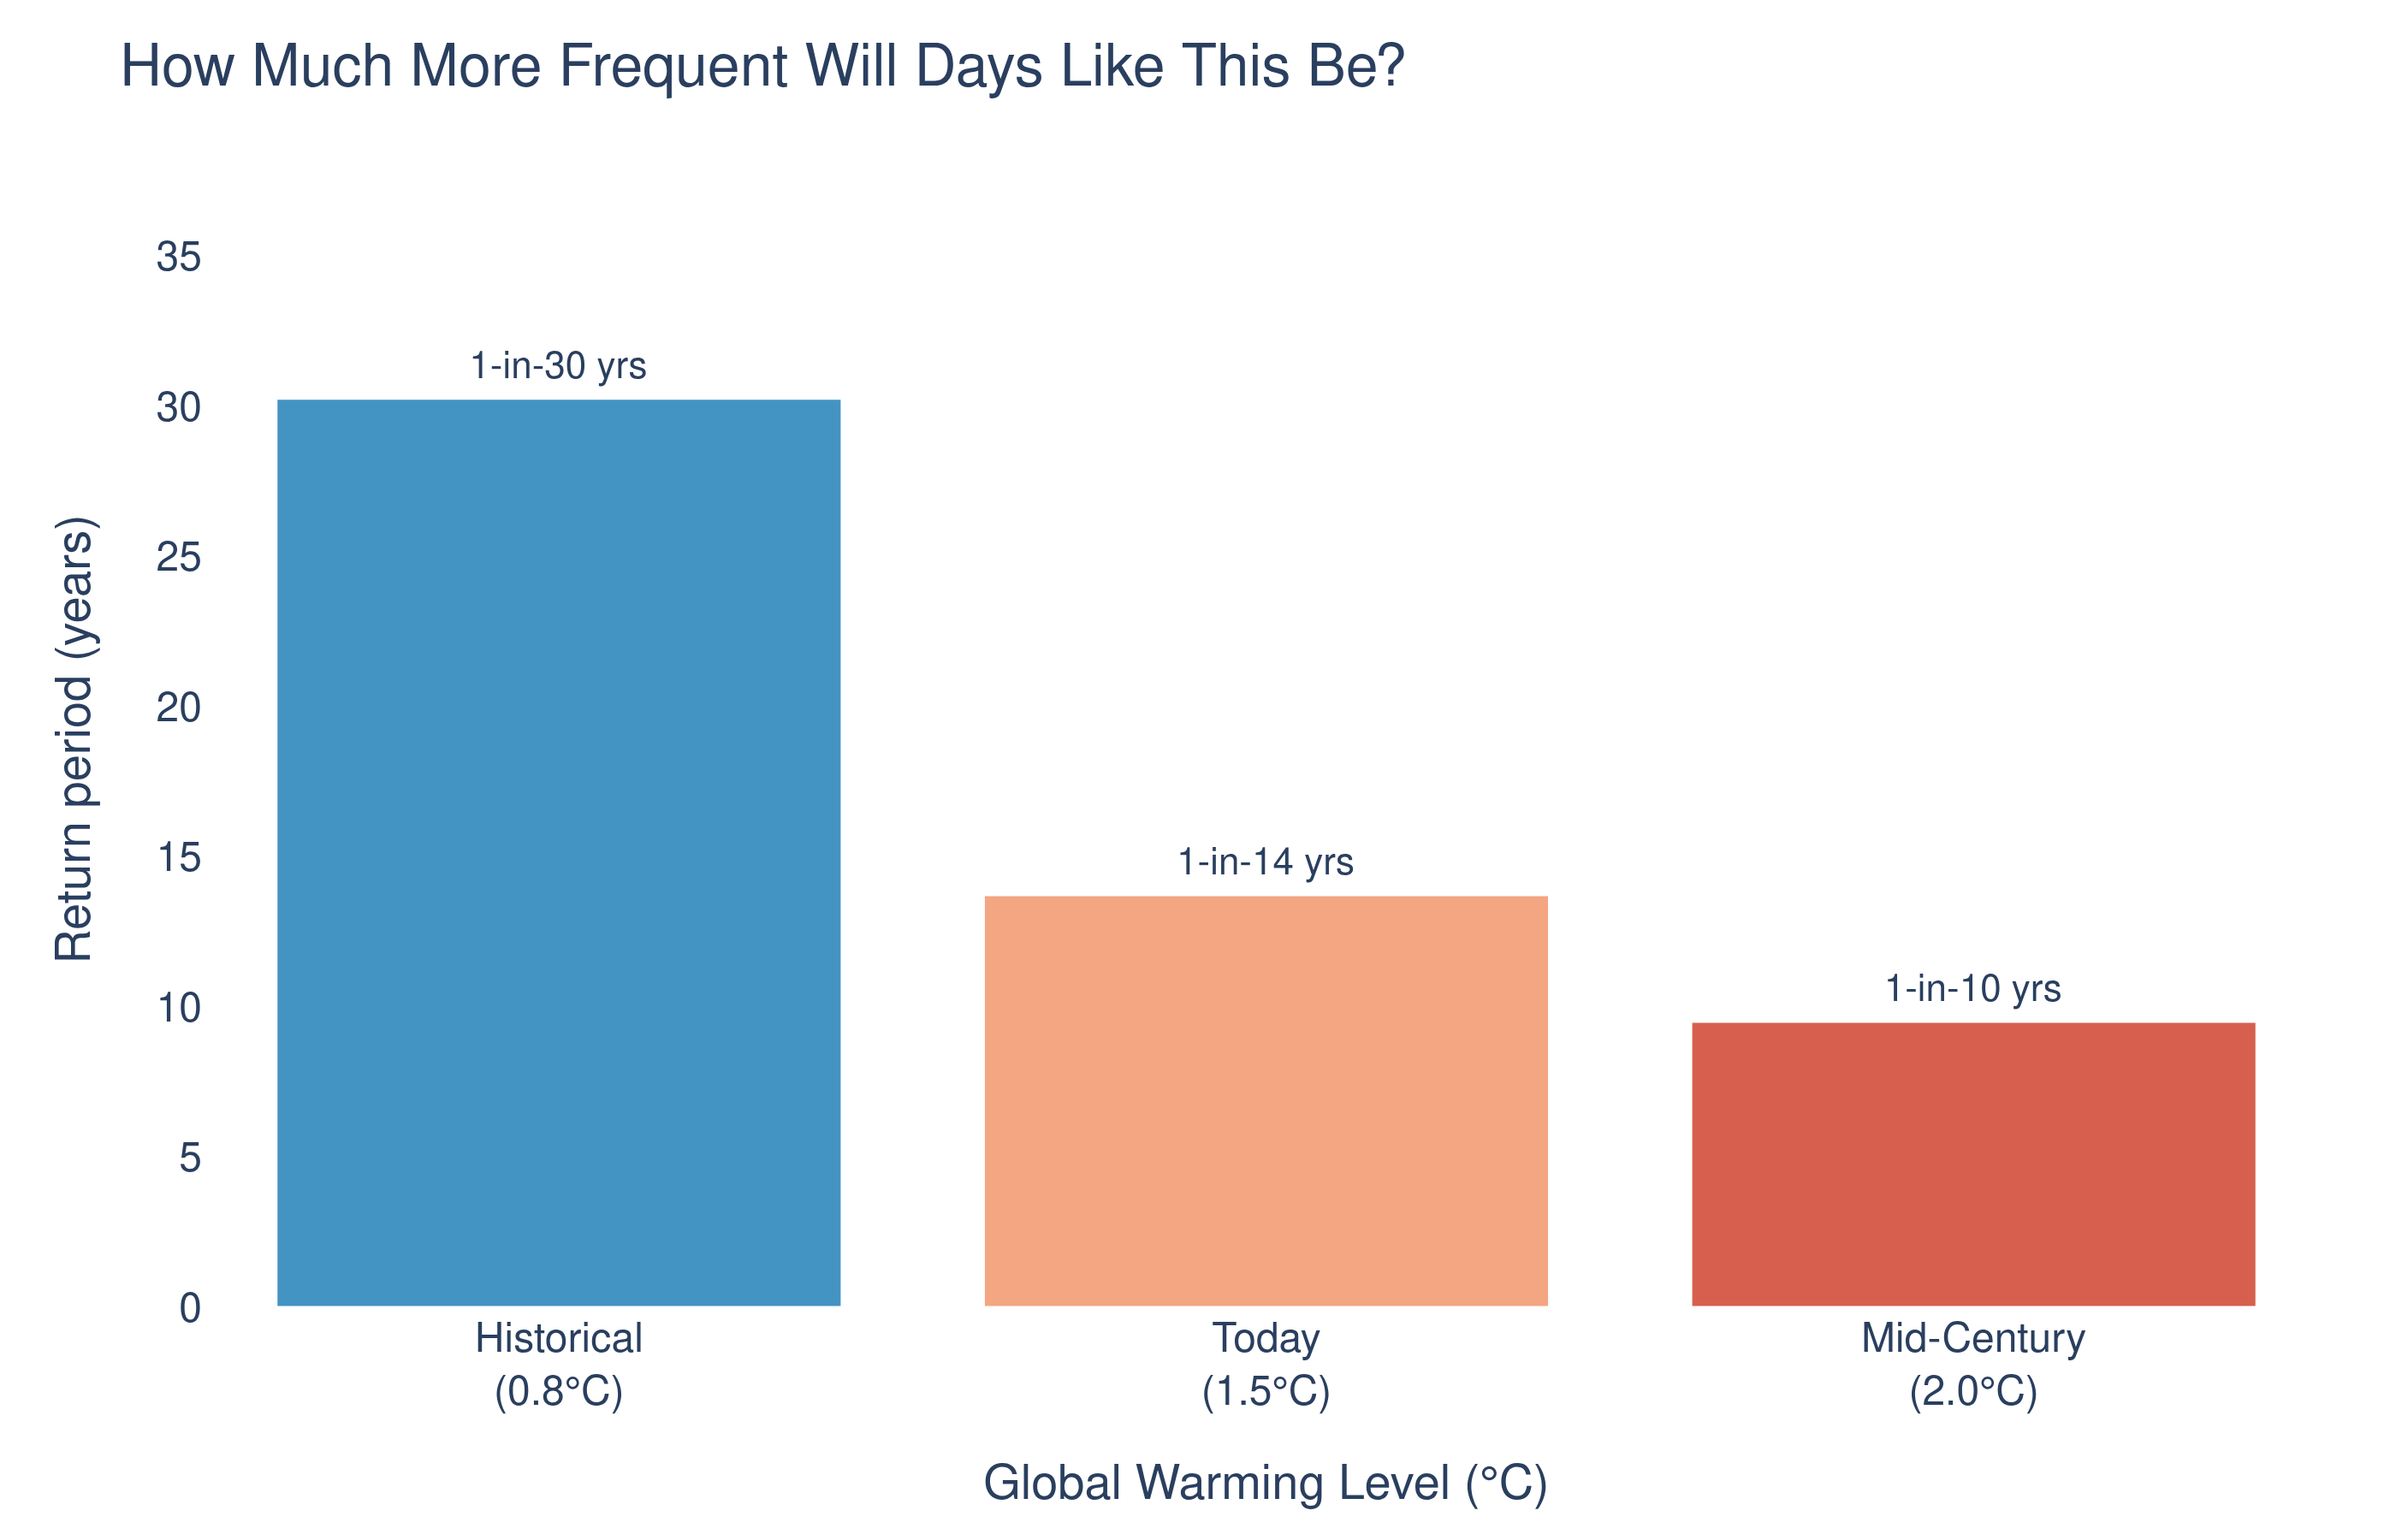
Historically, this event could be characterized as a 1 in 30 year event. Under today’s climate conditions, this type of heat wave is characterized as a 1 in 14 year event. By mid-century, this event could become a 1 in 10 year event.
Though still infrequent, the implications of this change are significant. The more frequently these events occur, the less time communities have to recover and adapt between events, and the more likely it is that the cumulative impacts will be felt across public health, infrastructure, and the economy. We’ll explore some of these impacts in the next section.
Impacts of Extreme Heat on People and Infrastructure
Below, we explore three defining avenues of extreme heat impact on communities.
During extreme heat, the electrical grid comes under significant strain as rising cooling demand drives energy demand upward. This stress is compounded because high temperatures simultaneously reduce transmission line capacity and lower the efficiency of thermal power plants. As demand climbs, the system’s ability to supply declines.
On August 14 and 15, 2020, the grid faced its limit. CAISO declared a grid emergency as demand outpaced supply, leading to rolling blackouts which affected hundreds of thousands of Californians for the first time since 20014.
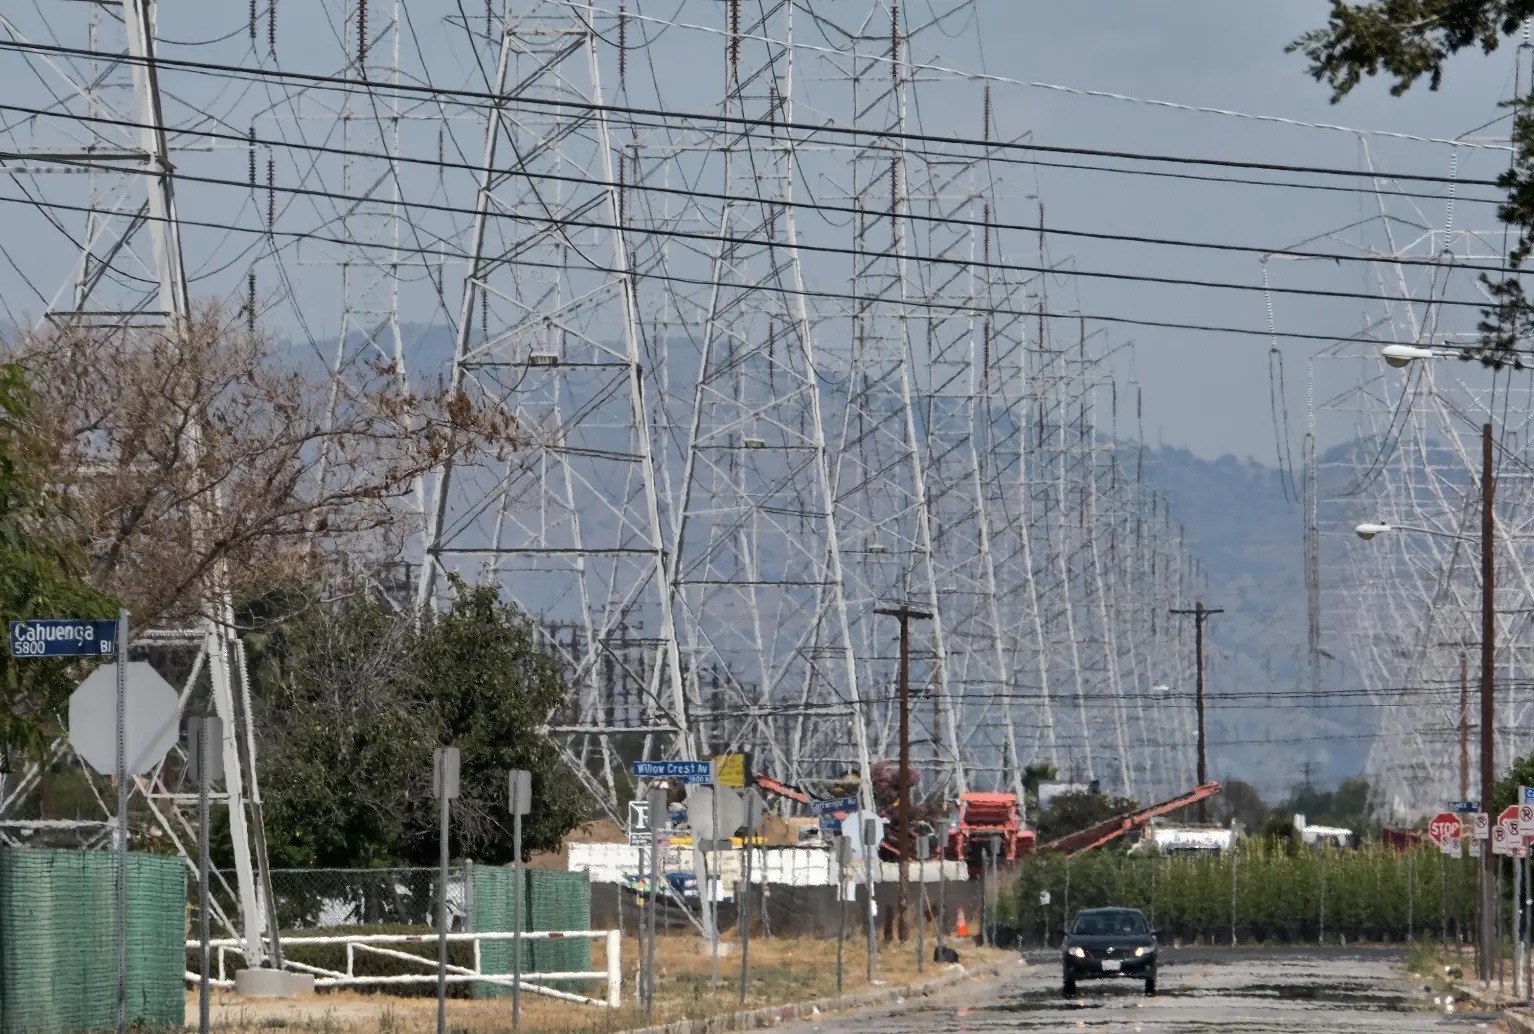 California grid overwhelmed and ordered rolling power outages during the August 2020 heat wave.
In response to events like the August 2020 heat waves, California has strengthened its grid resilience, with the California Energy Commission (CEC) reporting that “up to 4,500 MW of contingency resources are available for summer 2026 in case of extreme events that strain the grid”5. Still, as our climate continues to change, increasing the likelihood of extreme events, will our grid be reliable enough to withstand these stressors?
Extreme heat is already the deadliest weather hazard in the United States, outpacing floods, tornadoes, and hurricanes6. A three-fold increase in event frequency translates directly into greater cumulative health risk, particularly for underserved communities including the elderly, outdoor workers, and those without access to cooling resources7. As extreme heat continues to increase, researchers project California will see an additional 1.5 million heat-driven emergency department visits by 20508.
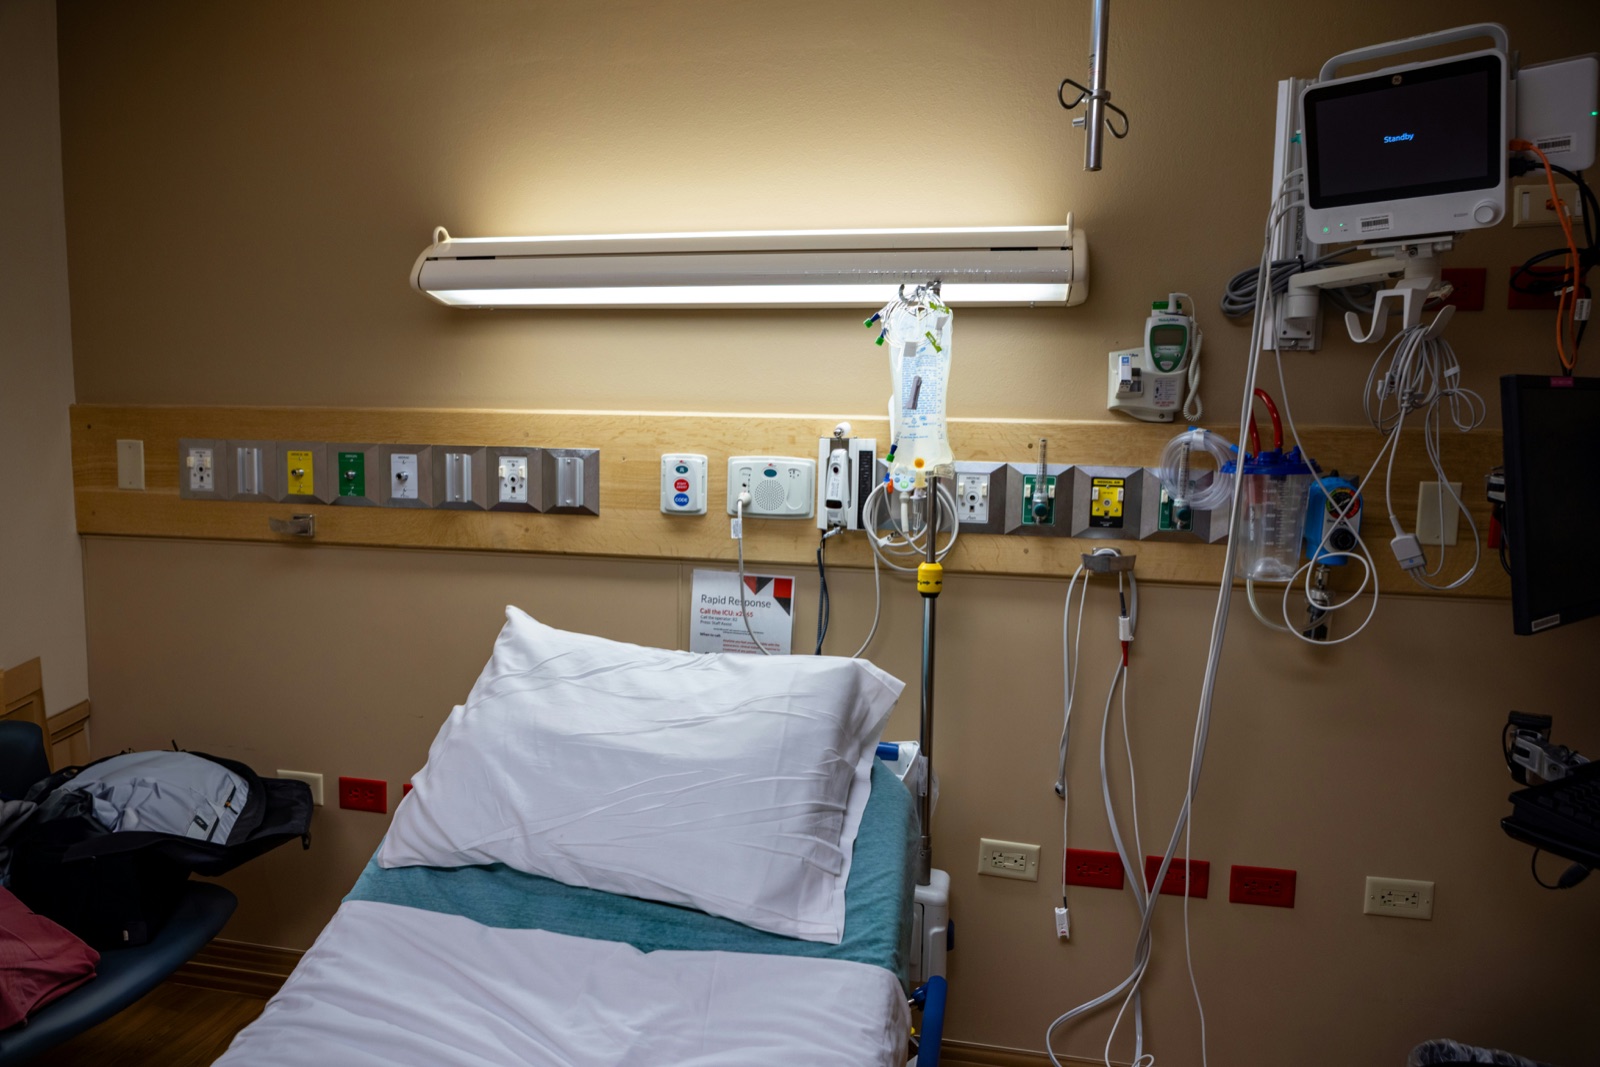 Surge in heat-related emergency room visits during the 2020 heat wave.
Not everyone experiences extreme heat equally. In Sacramento, lower-income neighborhoods and communities of color are often located in urban heat islands, areas where pavement, impervious surfaces, and low tree canopy push ambient temperatures several degrees higher than surrounding areas. Residents without air conditioning, renters unable to improve their cooling-related infrastructure, and people who work outdoors are more vulnerable to extreme heat than those with the ability to prepare and adapt.
 Heat inequity in Sacramento: low-canopy, high-pavement neighborhoods experience significantly higher temperatures than more affluent areas.
How will these impacts affect communities within Sacramento County differently? How will already vulnerable communities be affected by the projected increase in frequency of extreme heat events? Let’s take a look at the data.
Understanding the Spatial Distribution of Heat Risk and Equity Vulnerabilities
We’ve already seen that extreme heat events are projected to become more frequent in Sacramento County, but how will that risk be distributed across the region? And how does that risk intersect with existing vulnerabilities?
Below, in Figure 5, we’ve mapped the projected number of these extreme heat events across Sacramento County census tracts at three planning horizons, bounded by zip codes for readability.
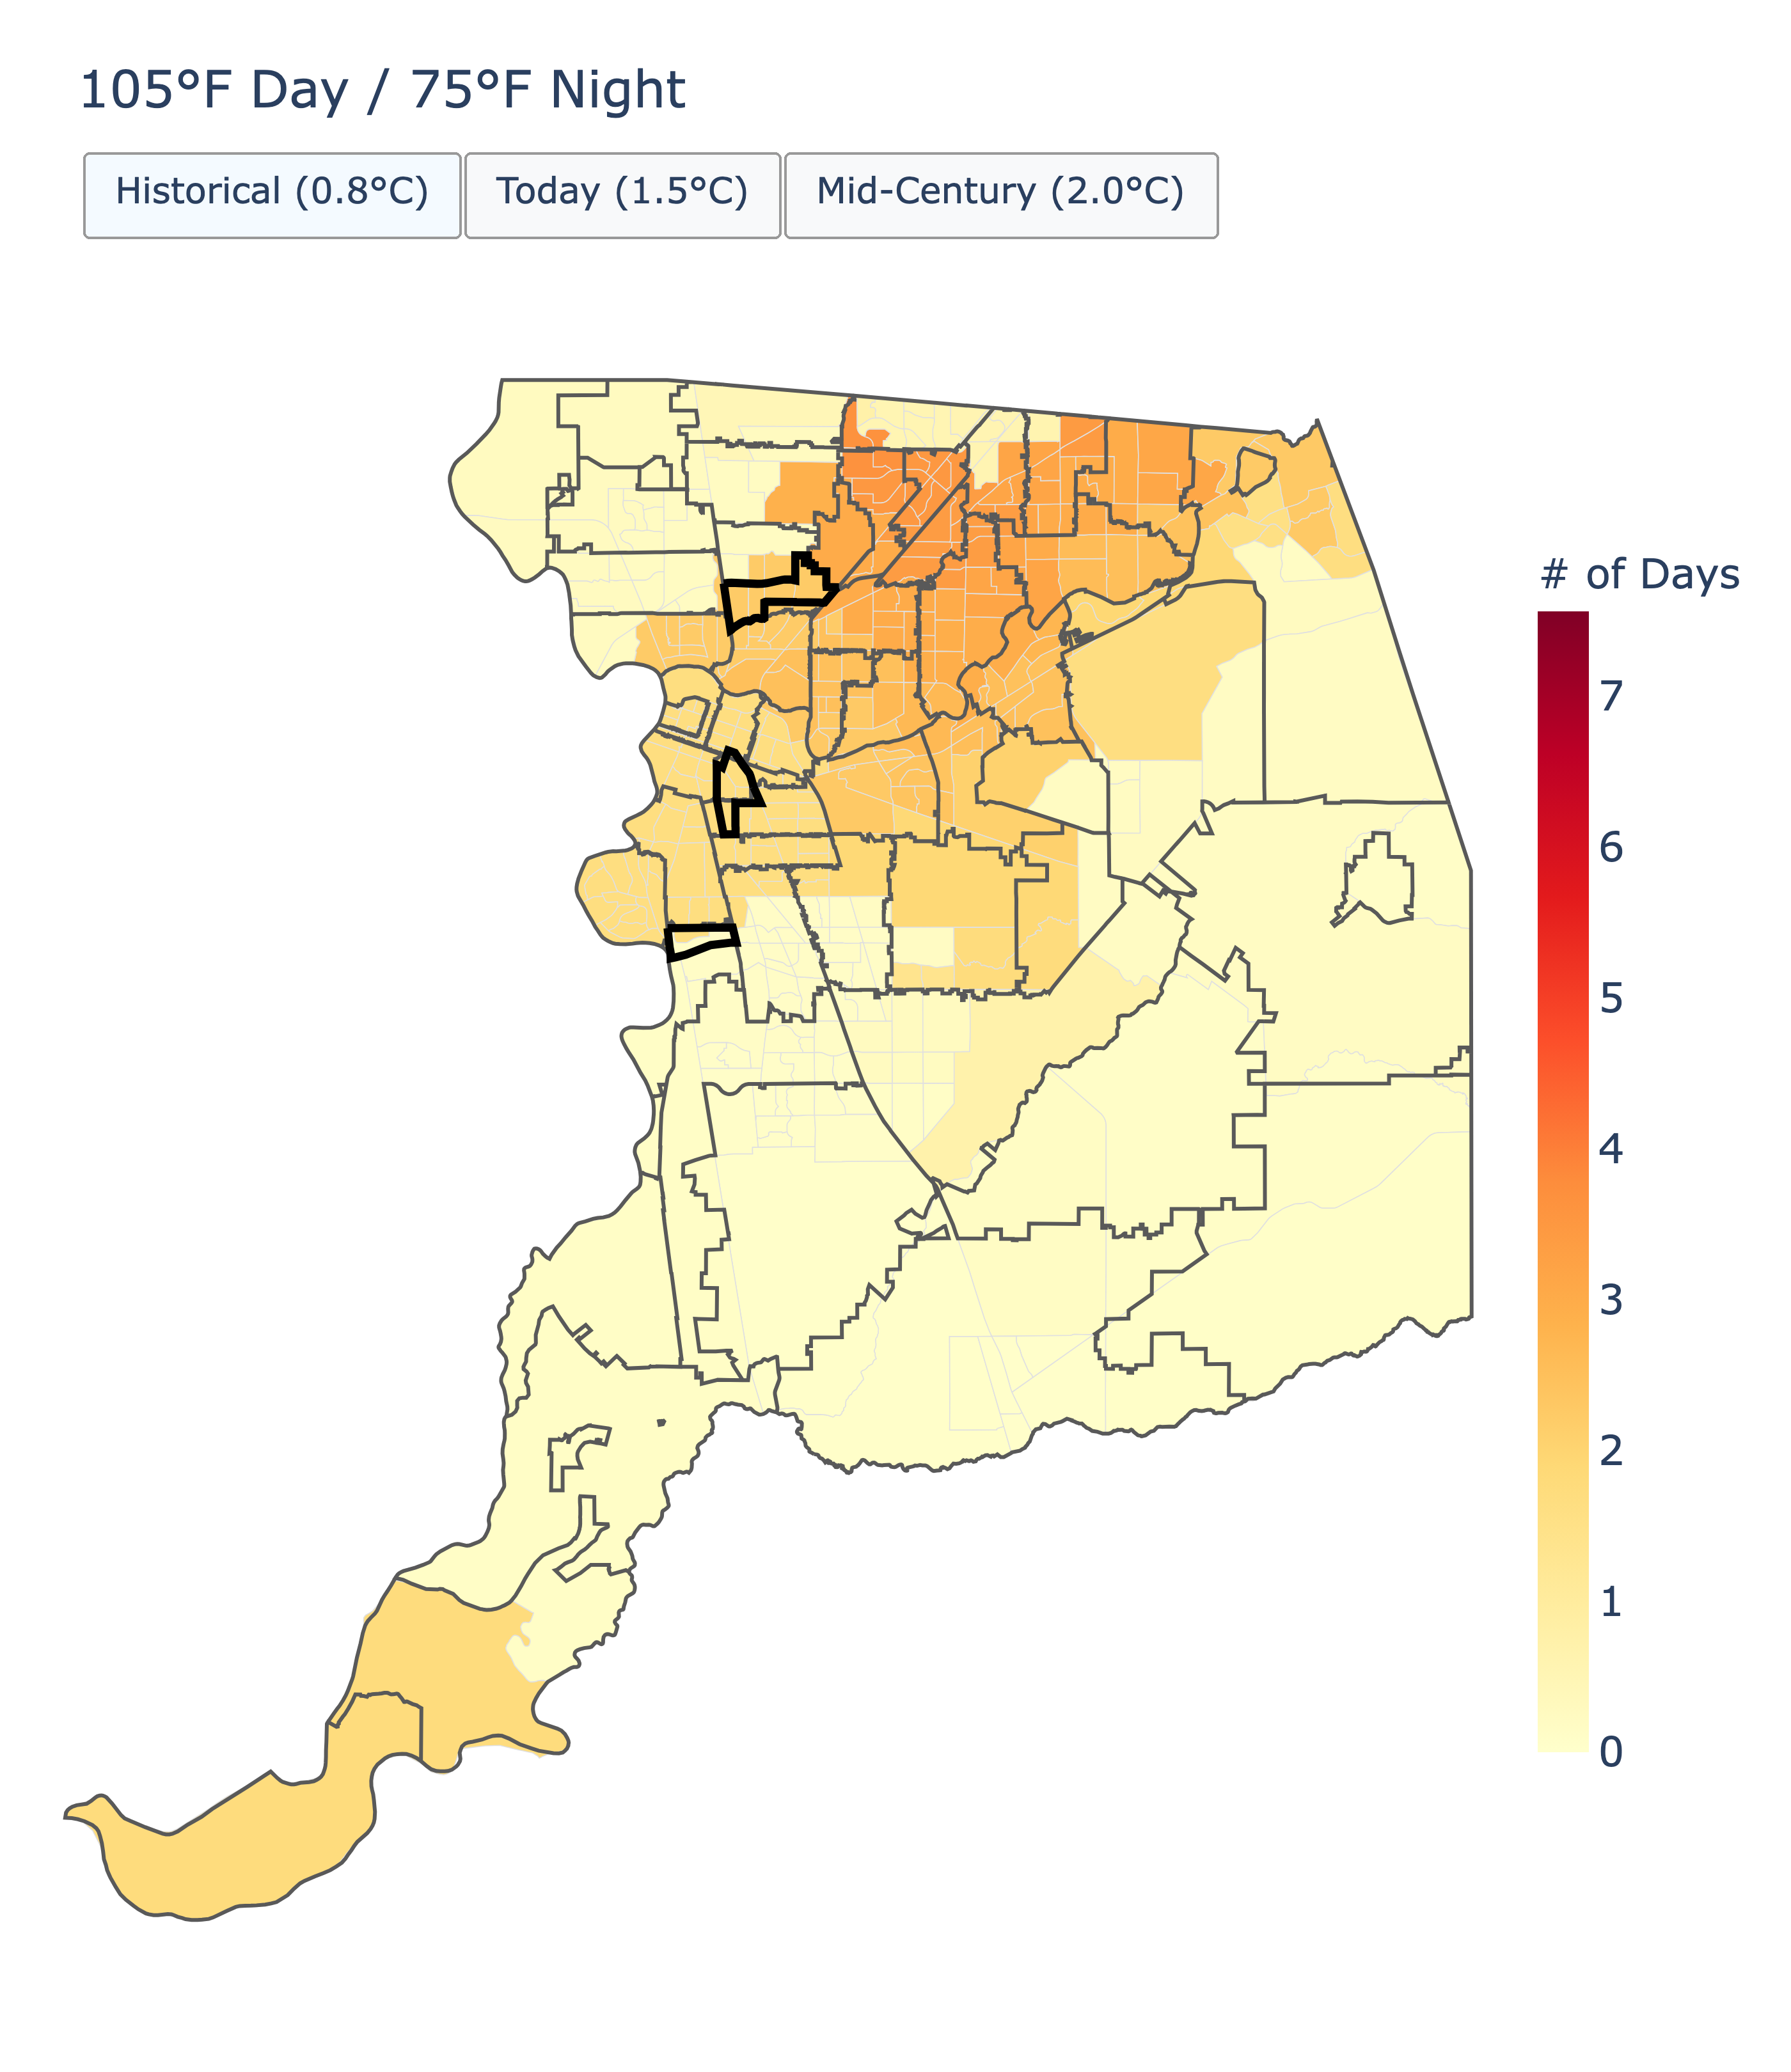
There is a clear diagonal warming trend appearing across Sacramento County, mirroring the county’s most urbanized areas (urban heat island effect). Some urban areas are excluded below, which is likely due to reprieve from the delta breeze2.
However, not all areas are equally vulnerable to heat. Next, we’ll look at how the projected increase in heat hazard intersects with existing equity vulnerabilities across the county.
In order to explore this intersection of datasets, we’ll look at the California Climate Risk and Adaptation Index (Cal-CRAI). The Cal-CRAI uses a combination of climate hazard and social vulnerability metrics to assess the relative risk of climate impacts across communities. For more information, check out the Cal-CRAI documentation.
Below, in Figure 6, we’ve used the Cal-CRAI index to map the change in heat hazard score across Sacramento County census tracts relative to the historical baseline. Red indicates an increase in projected heat risk for that community, blue indicates a decrease.
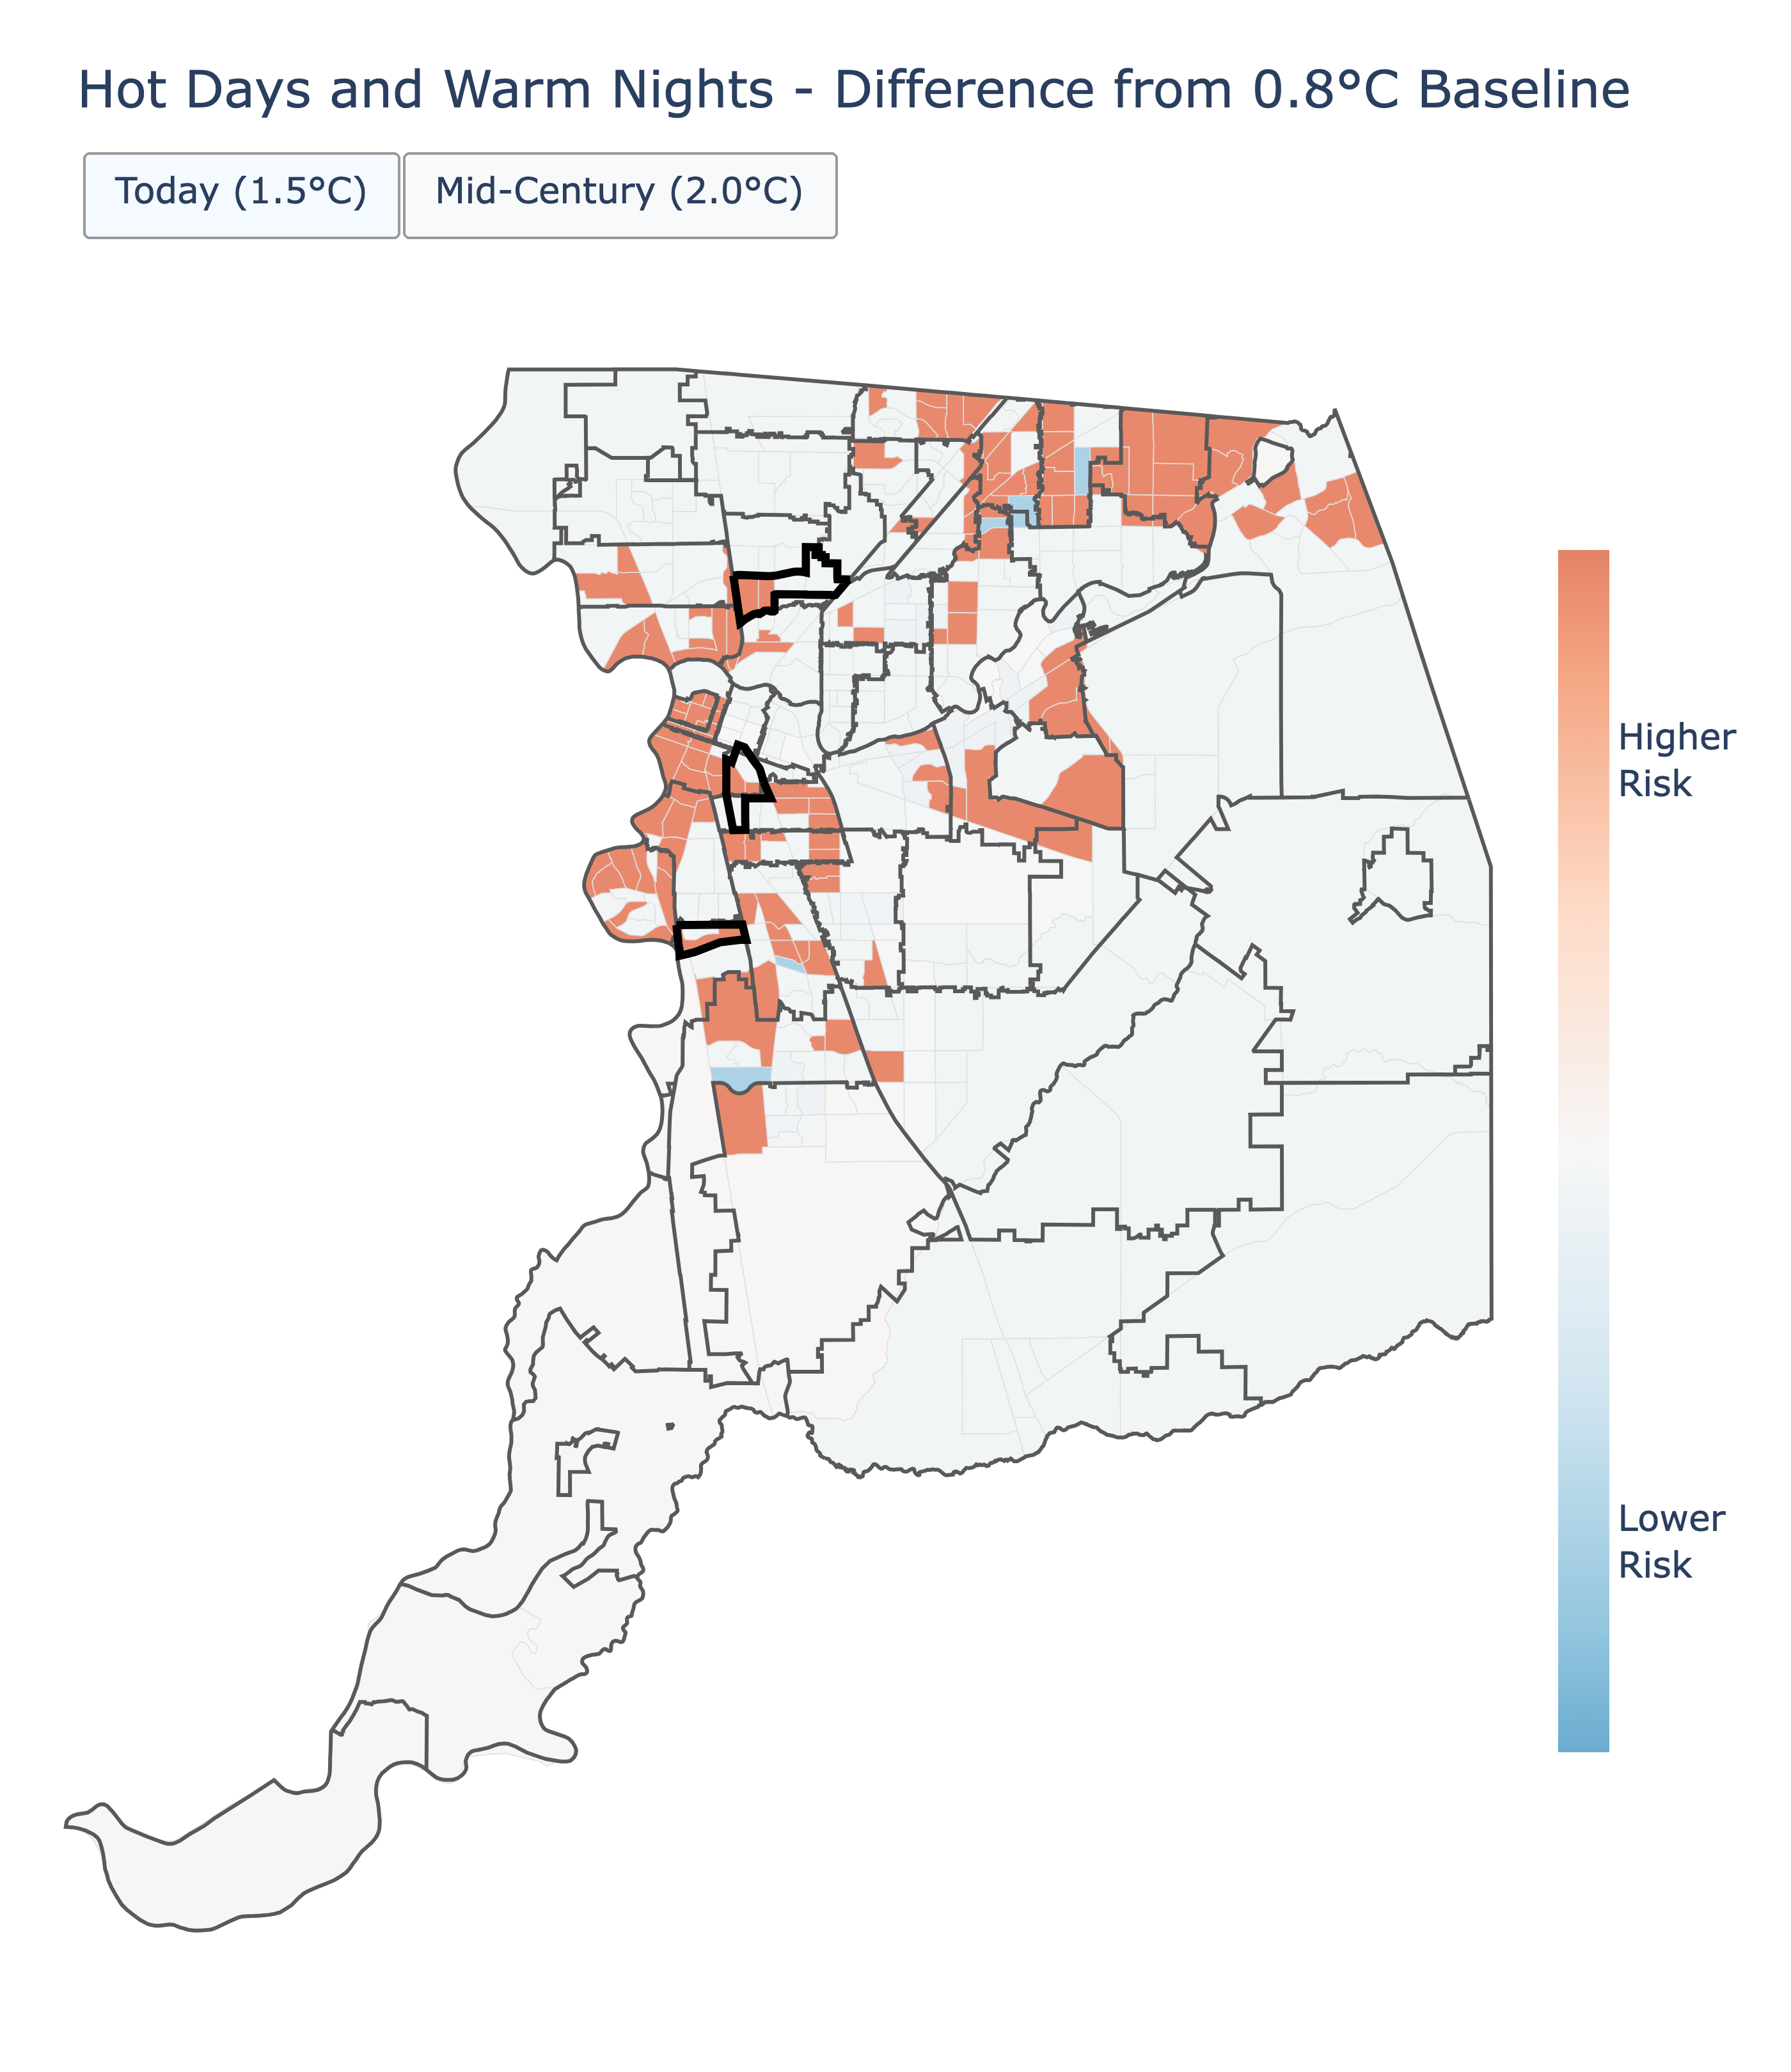
In the figure above, we can see clear disparities in heat vulnerability across census tracts in Sacramento, consistent with the urban forest plan referenced above1. Neighborhoods including Del Paso Heights, Meadowview, and Oak Park consistently register elevated risk scores (highlighted above with a black border, hover to see each neighborhood name), and the county’s urban core showing an interspersed pattern of heightened risk throughout. Most notably, the division we see between the two high-risk clusters on the map (the northeast and the southwest) is due to the American River. The census tracts immediately on its banks are home to more affluent residents, and as a result have lower social vulnerability when it comes to hazardous heat9. This underscores how proximity to the same natural resource can produce starkly different resiliency outcomes for communities.
While risk of exposure to extreme heat is projected to continue to grow over time, there are many different solutions available to address it. Sacramento County has already begun implementing some of them. Let’s take a look at what has been done and what opportunities remain to build a climate-resilient future.
Cooling Solutions To Address A Changing Climate
Communities around the world, including in California, have already begun implementing strategies that demonstrably reduce heat exposure. Below are a few of the most effective strategies for mitigating extreme heat, particularly in urban areas like Sacramento County10.
Effective Cooling Solutions
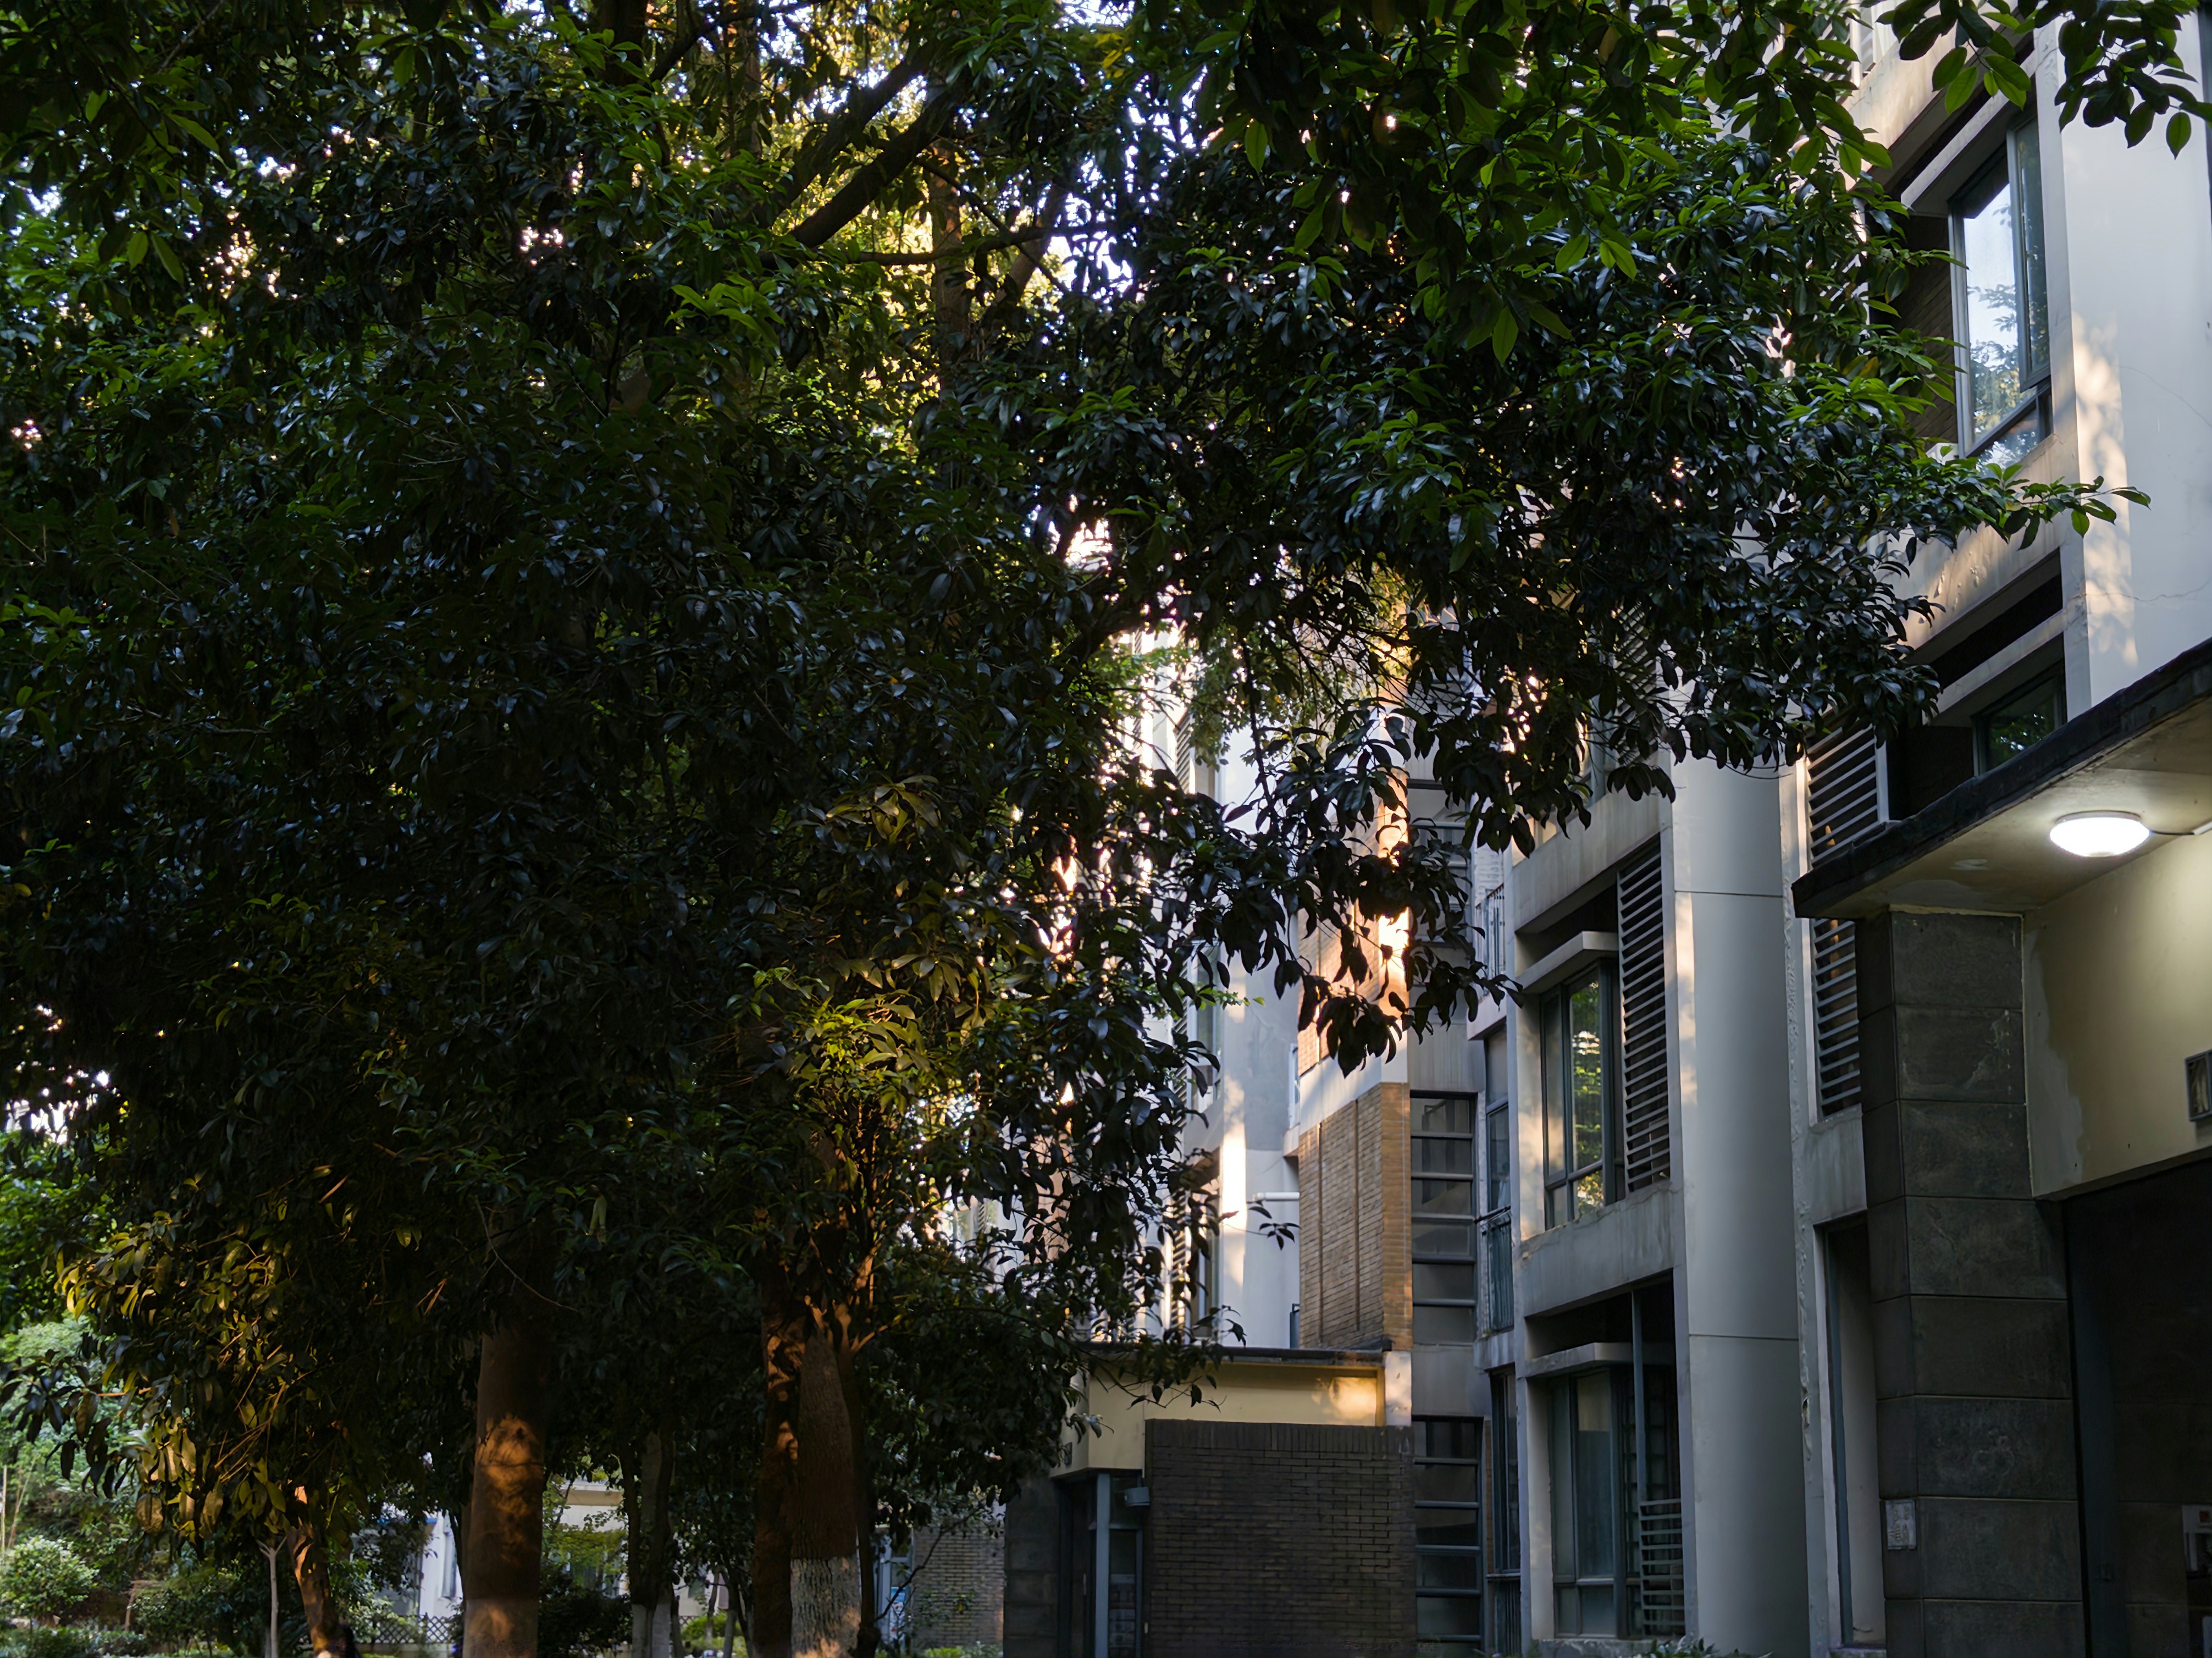
Urban Tree Canopy
Trees shade pavement and cool the air through evapotranspiration (i.e. water evaporating from leaves and soil into the atmosphere). Because of this effect, canopy cover is one of the most effective tools for reducing heat exposure in cities, whether that’s through street trees, park trees, or green roofs.
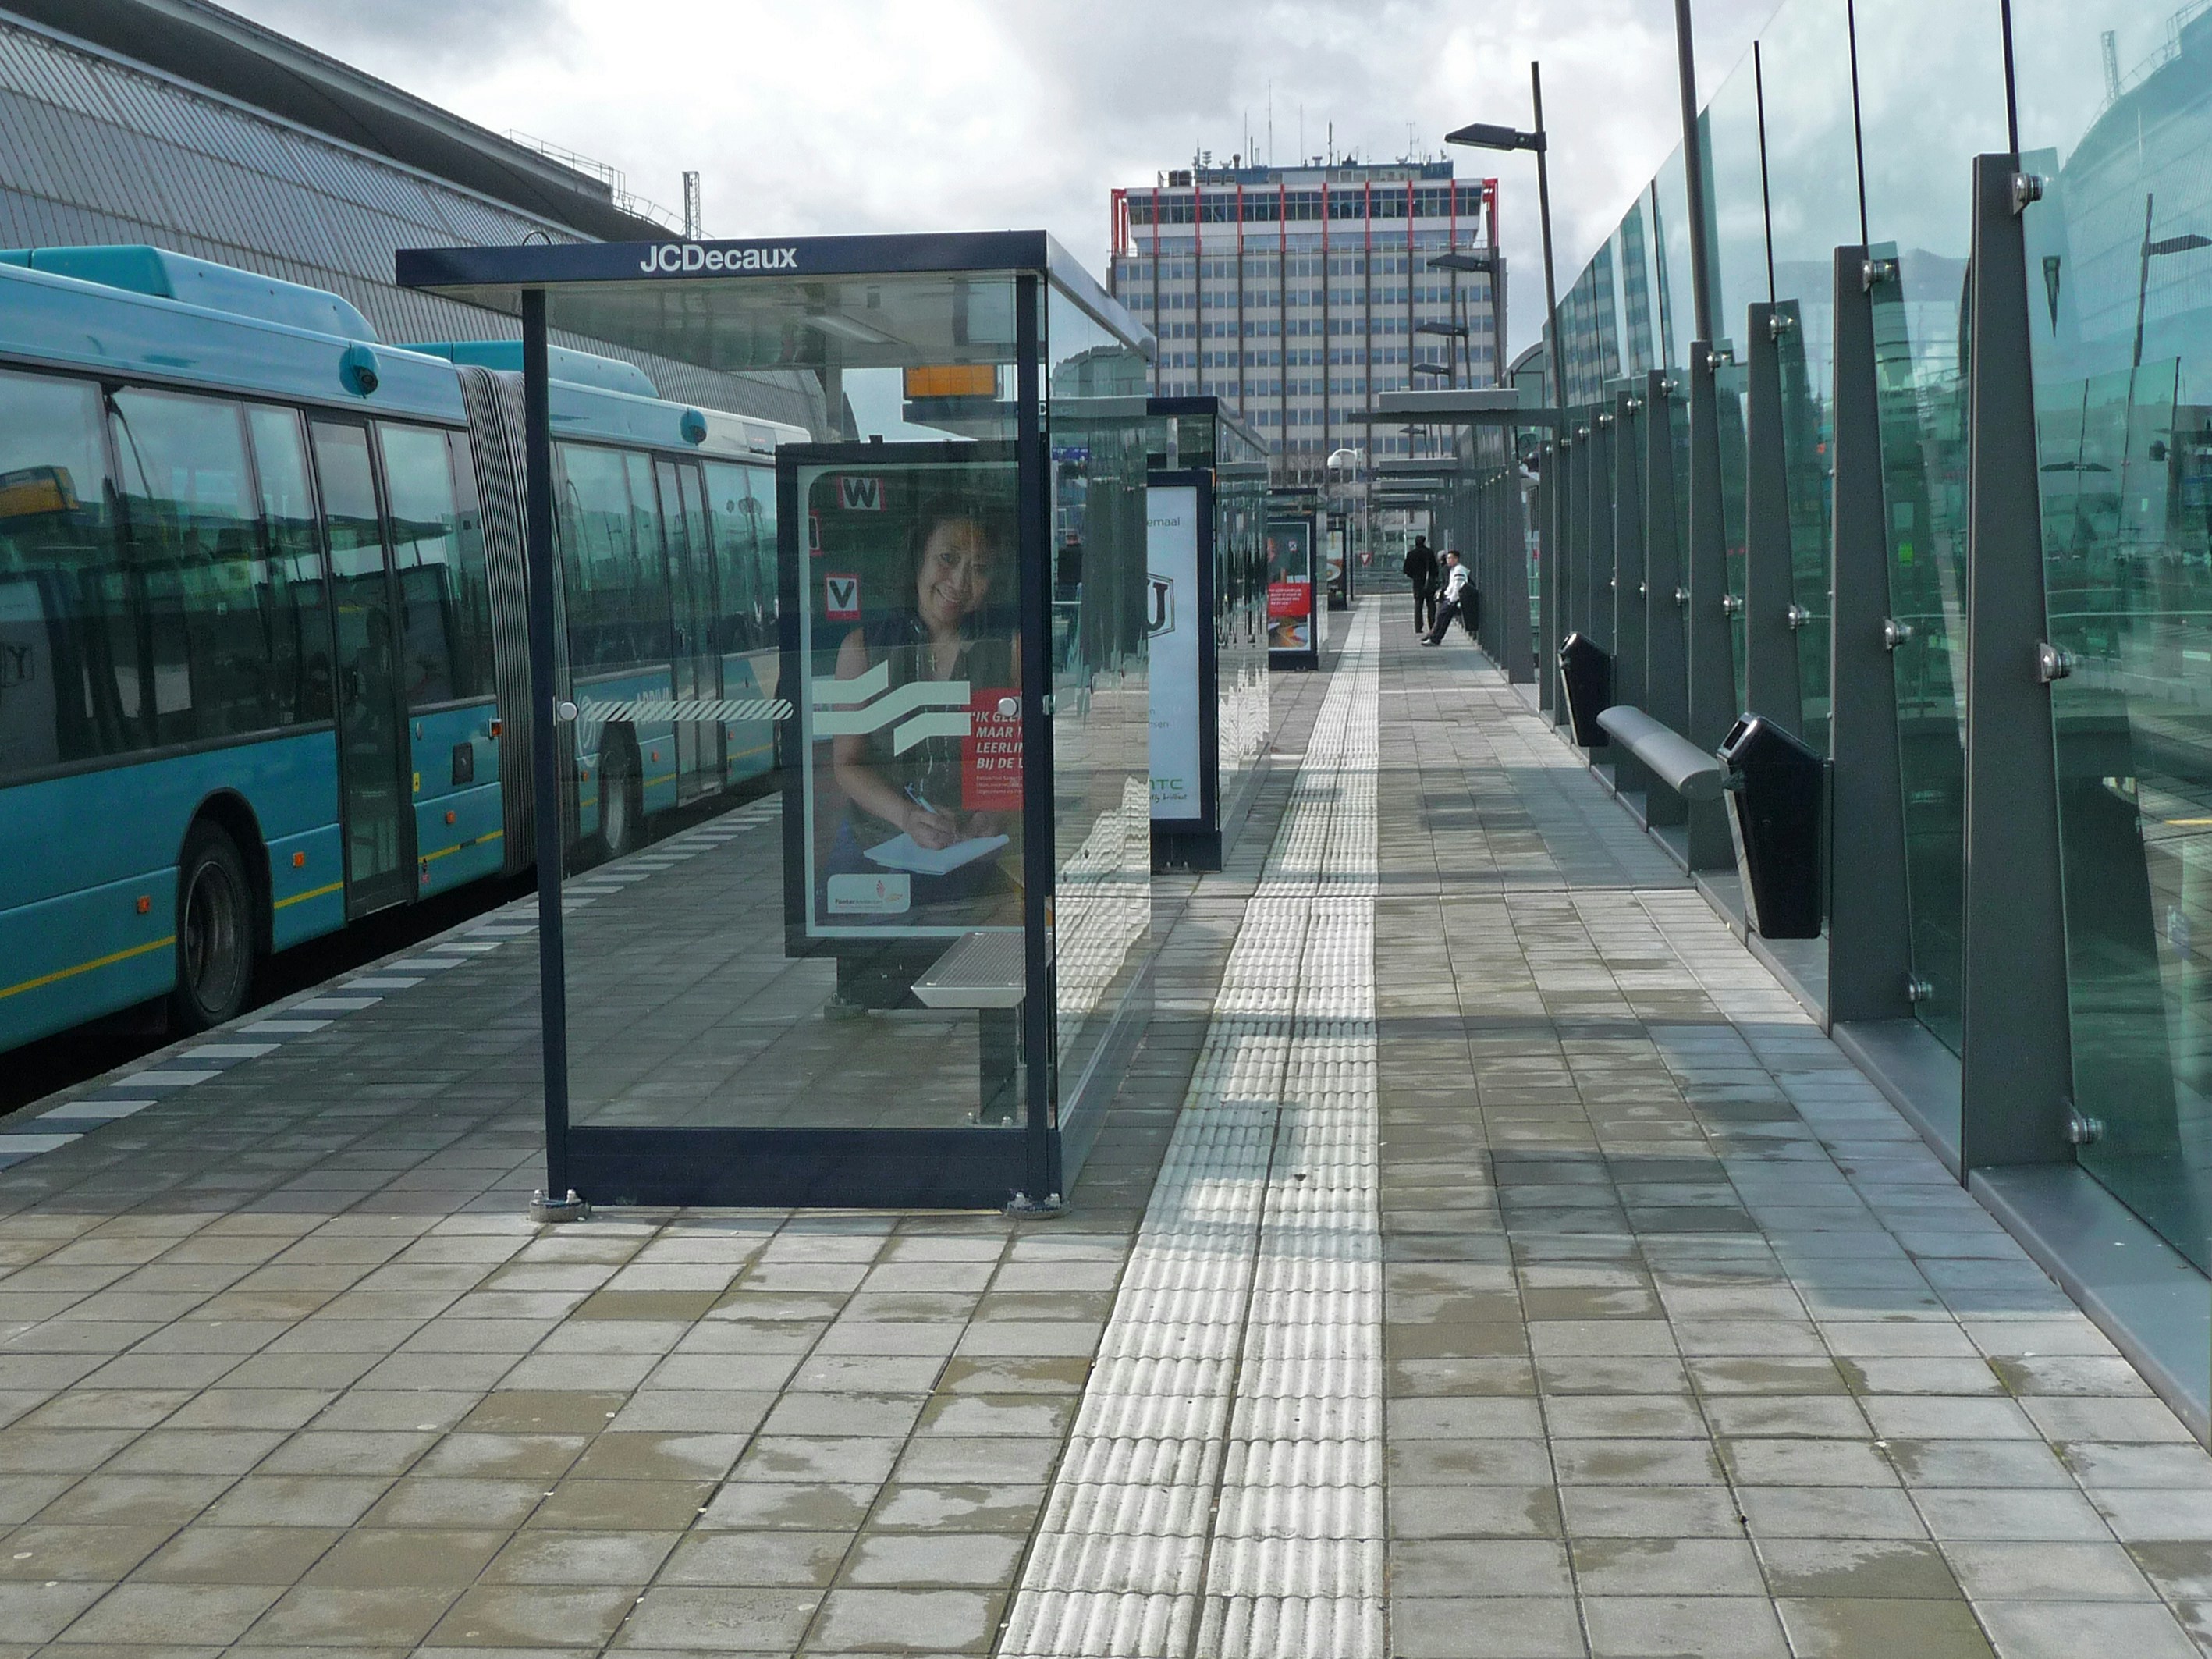
Cool Corridors
Shaded pedestrian and transit routes connecting cooling centers, parks, and public facilities can help cut heat exposure for people traveling on foot. Cool corridors can be implemented in tandem with urban forestry programs to maximize cooling benefits.

Cooling Centers & Refuge Spaces
Air-conditioned public spaces give people without reliable home cooling somewhere safe to go during dangerous heat events. Unlike shade or vegetation, they don’t lower ambient temperature. However, they are critical public infrastructure for anyone to retreat to during the hottest times of the day to cool down for free.
For a broader look at cooling solutions cities are using worldwide, see this World Resources Institute report.
What Is Already Being Done For Sacramento County

Urban Tree Canopy Expansion
Through NeighborWoods and the City’s Urban Forest Plan, Sacramento has planted roughly 1.5 million trees county-wide, including 13,000+ shade trees, and engaged 6,000+ residents in FY2024 (Oct ‘23 - Sept ‘ 24) alone, working toward a target of 25,000 trees/year. Cooling-effectiveness research finds canopy cover consistently outperforms building shading and pervious surfaces, with reductions of 1–3°C (1.8–5.4°F), and is the broadest, most continuous intervention available county-wide11.

Cooling Centers Network
The county operates a network of publicly accessible cooling centers that activate in step with the National Weather Service’s HeatRisk Red/Magenta levels. More than 20 sites were activated during the 2020 heat waves. The reach of cooling centers is narrower than canopy cover since it only serves people during an active emergency, but this network is critical infrastructure for people to take reprieve during the hottest hours of the day.
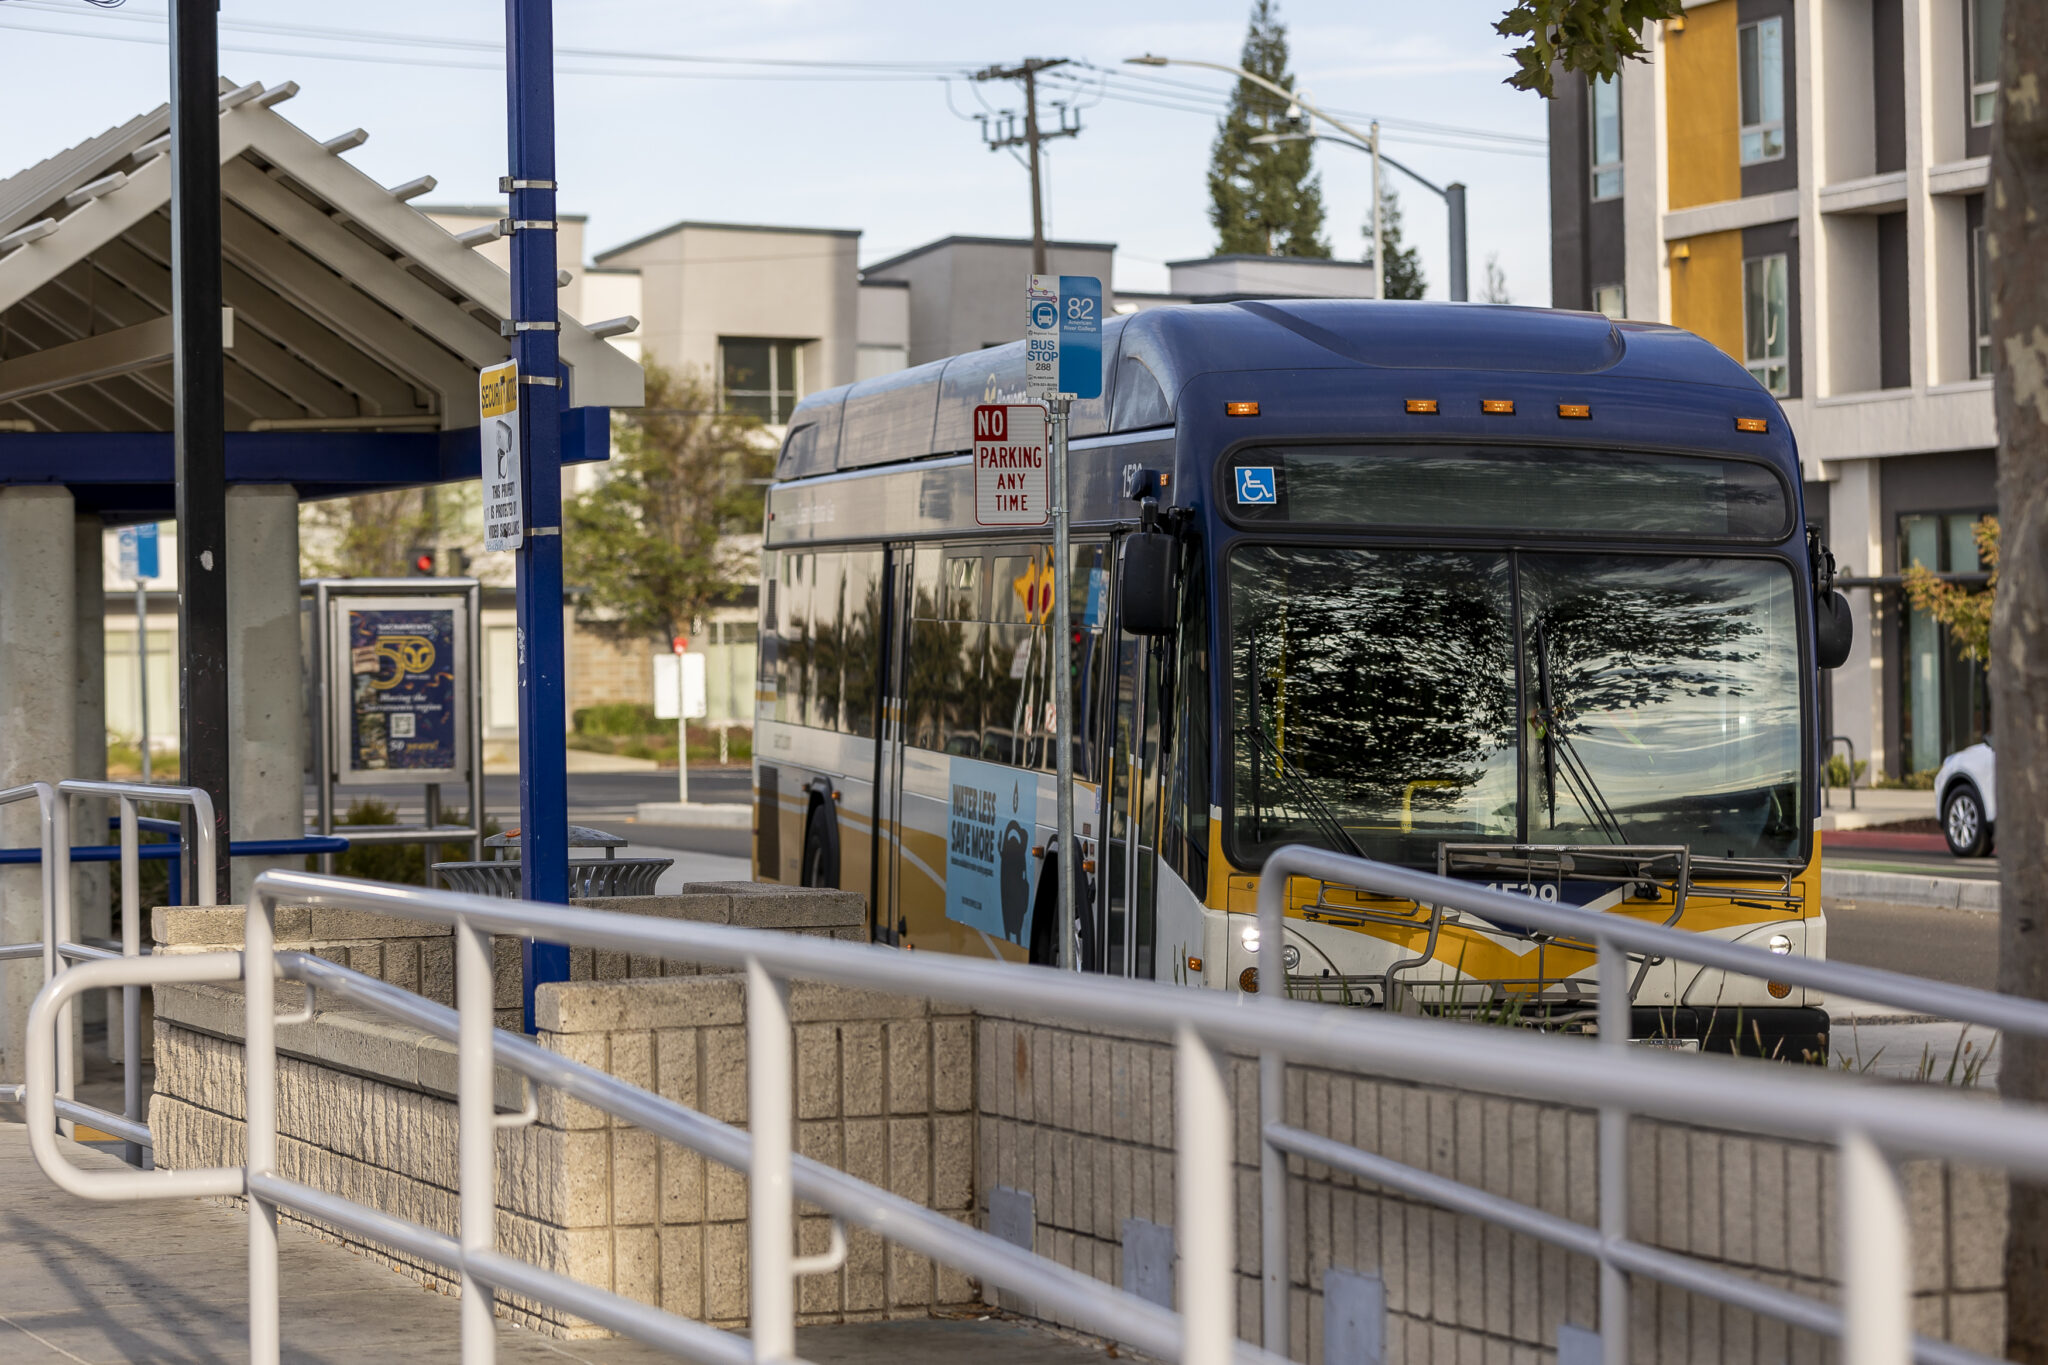
SacRT Heat-Resilient Bus Shelters
SacRT was awarded $449,900 to build up to 20 heat-resilient shelters at bus stops in disadvantaged communities across Citrus Heights, Folsom, Rancho Cordova, and Sacramento. This has been a targeted investment for transit-dependent riders, though a small fraction of the county’s full bus-stop network12.
What Can I Do About Extreme Heat Waves in My Area?
A changing climate will affect everyone, no matter where you live. The good news is that your community likely already has resources in place, and there are meaningful actions at every scale.
- Know where your nearest cooling center is before you need it. Most counties publish this through their emergency management office or public health department.
- Sign up for your local emergency alert system so heat warnings reach you automatically.
- Advocate for shade equity in parks and transit corridors, particularly in neighborhoods with low tree canopy.
- Support urban forestry and cool corridor planning through your local planning commission or city council.
- Check on your neighbors and other community members, particularly the elderly and those with limited mobility, during extreme heat events. Social isolation is a well-established risk factor for heat-related illness and death, particularly among people who live alone or lack regular social contact13.
- Prioritize urban forestry and green infrastructure funding in high-risk, low-resource communities. These neighborhoods are often underserved by green infrastructure, and targeting them is both more equitable and more efficient. Green canopy delivers its greatest cooling return exactly where canopy is lowest and density is highest14.
- Update heat emergency plans with robust early warning systems as warming events increase in frequency over time, as they can result in a 49-73% reduction in emergency medical dispatches on heat wave days15.
- Integrate extreme heat risk into capital improvement planning across new infrastructure, ensuring public buildings, transit systems, and energy infrastructure are designed to withstand escalating heat exposure over their operational lifetime.
Explore your county’s climate adaptation actions →
Data & Tools Used in This Analysis
Data
- Weather station data: Historical Data Platform (HDP), KSAC (Sacramento Executive Airport,
ASOSAWOS_72483023232), accessed via Cal-Adapt Analytics Engine - Climate model projections: WRF dynamically-downscaled projections (UCLA, SSP3-7.0, 3 km resolution, d03 grid), accessed via Cal-Adapt Analytics Engine
- Climate risk data layers: Ford, V., Espinoza, J., & McClenny, B. (2024). California Climate Risk and Adaptation Index Metric Files and Metadata, v1 [Data set]. Eagle Rock Analytics.
Tools
This analysis was built using climakitae, Cal-Adapt’s open-source Python library for climate data access and analysis.
Explore the climate projections for your own area at cal-adapt.org. For tools focused specifically on extreme heat, see our extreme heat tool on cal-adapt.org.
Get In Touch
Were you in Sacramento during the August or September 2020 heat waves?
If you’re interested in sharing how you were affected, what you experienced, what resources you did or didn’t have access to, or how your neighborhood handled it, we want to hear from you! Please reach out to us to share your story.
Are you a researcher, planner, policymaker, or an enthusiast interested in this analysis or chatting with us further?
Please get in touch with us as well! We love talking about climate data, projections, and adaptation planning, and we’re always happy to connect with others working in this space.