Frequently Asked Questions
General
What is JupyterHub?
JupyterHub gives users access to standardized computational environments and data resources through a webpage without having to install complex software. Our JupyterHub is maintained by the Analytics Engine team.
Who can use this service?
The Analytics Engine JupyterHub service is currently open to a select group of users invited to alpha test the Analytics Engine. If you are interested in being notified of when the Analytics Engine will be made available to the general public or if you would like to join our group of early testers, please send us an email.
What is JupyterLab?
JupyterLab is a web-based interactive development environment for notebooks, code, and data. Its flexible interface allows users to configure and arrange workflows in data science, scientific computing, computational journalism, and machine learning.
What packages and libraries are available?
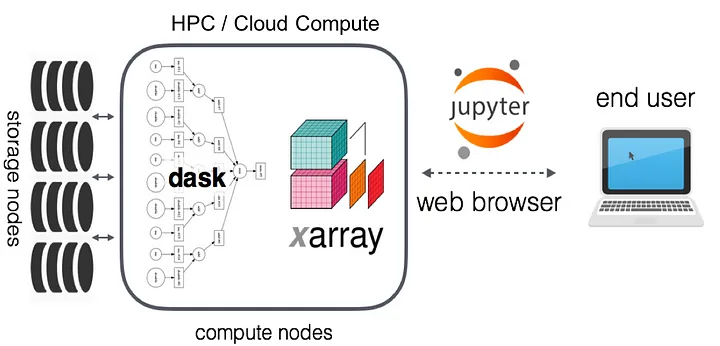
Our JupyterHub is built using the Pangeo ecosystem along with ClimaKitAE, a climate data processing Python library developed by the Analytics Engine team and Climakitaegui, a helper package that adds GUI functionality for use in our JupyterHub.
Pangeo provides Python tools (e.g. xarray, Dask, JupyterLab) and cloud infrastructure that enables near-instantaneous access and fast data processing of large climate and other datasets used in geosciences.
ClimaKitAE provides an analytical toolkit for working with downscaled CMIP6 data. You can use ClimaKitAE for complex analysis like selecting models for a specific metric, deriving threshold based assessments, etc. It also provides common functionality for working with climate datasets such as temporal and spatial aggregation & downloading timeseries for a weather station.
What data is available?
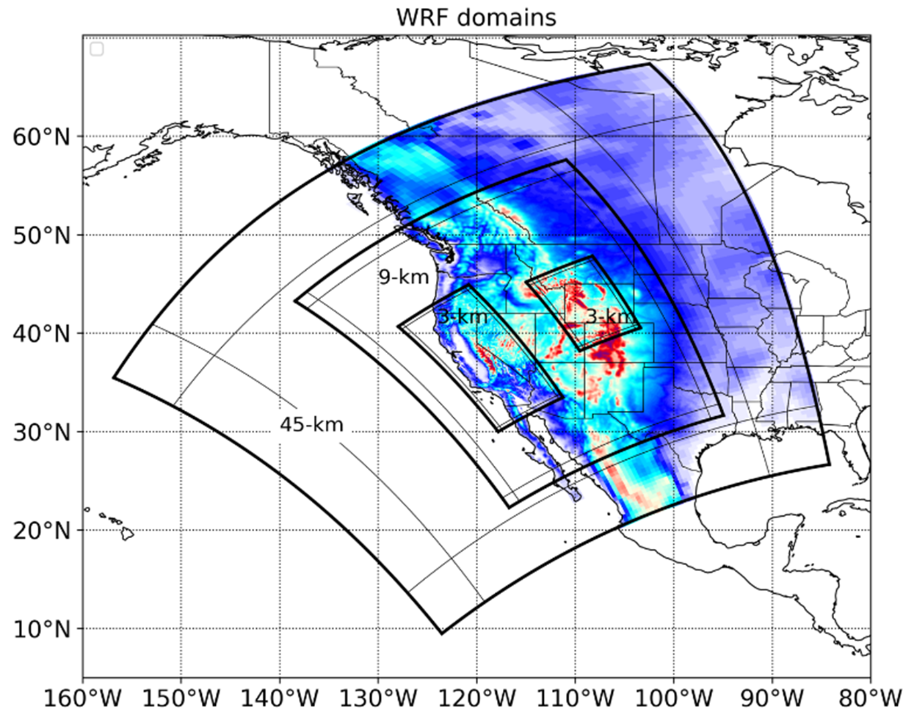
Downscaled climate projections in support of California’s Fifth Climate Change Assessment are available via two different downscaling methods (dynamically downscaled and statistically downscaled), with coarse resolution data available for western North America, and the finest scale (3-km) available over California state (see figure below). Fore more detailed information, visit our data catalog.
Can I use Analytics Engine within my own organization’s cloud?
You can run the Analytics Engine within your organization’s AWS cloud using a Docker image from the Pangeo team. That image is then run in a container from Kubernetes with JupyterHub on AWS EKS.
Can I request a dataset to add to Analytics Engine?
Users may request the addition of datasets to the platform for use in the cloud computing environment, which will be approved on a case-by-case basis. Datasets are encouraged to comply with CF conventions (see Data Standards for more information). Requests for particular datasets should be sent via email.
Technical
When I run ckg.Select(), nothing is displayed. What should I do?
If next to the ckg.Select() cell you see a symbol like [*] - this indicates that the process is still running and the select panel should appear shortly. If there is a number in the brackets and not an asterisk, you may need to reset your kernel (click Kernel > Restart Kernel… from the toolbar). Resetting the kernel is a good first step in troubleshooting issues more generally on the JupyterHub (but note that if you do this you will need to re-run any computations).
What is dask?
Dask is a python library for parallel computing – meaning complicated computing tasks are separated and computed simultaneously on separate processors. Our tools automatically take advantage of this, if you start up a dask cluster at the beginning of your notebook. For more information about the various applications of this library, see the Dask library documentation.
I am confident with coding in python. How can I access the data catalog directly?
import intake
col = intake.open_esm_datastore('https://cadcat.s3.amazonaws.com/cae-collection.json')
See documentation for more on the usage of an ESM catalog.
How can I download the climate data used in the Analytics Engine?
All the climate data used by the Analytics Engine is stored in a publicly accessible AWS S3 bucket. If you are familiar with Python you can easily access the data directly using the xarray package or through the intake package with our intake ESM data catalog. Once opened as an xarray dataset, you can then export the data to a NetCDF file on your computer.
Here is a quick way to open an individual Zarr store with xarray:
import xarray as xr

ds = xr.open_zarr('s3://cadcat/wrf/ucla/cesm2/historical/1hr/lwdnb/d01', storage_options={'anon': True})
For a complete list of S3 data paths see the ESM catalog’s Zarr store CSV.
For a more detailed walkthrough on using the intake catalog to access and download data, check out this Jupyter notebook.
If you are looking for direct access to LOCA2-Hybrid NetCDF files, you can interactively browse the S3 bucket to download individual .nc files by variable, or install AWS CLI tools and run the following command to download everything:
aws s3 sync --no-sign-request s3://cadcat/loca2/aaa-ca-hybrid /my/local/pathPlease note that if you would like to download everything, you will need to change /my/local/path to a directory where you are able to store 12.7TB of data.
For more ways to access data on the Analytics Engine, check out our Accessing Data page.
What is the Coordinate Reference System (CRS) for the WRF data?
The CRS for the WRF data on the Analytics Engine is in Lambert Conformal Conic, which is a common projection used with WRF. The WRF data is not identified by a standard EPSG code or a datum, because the WRF projection is based on a spherical Earth. For more information on WRF projections, check out this blog post.
How can I access derived variables?
Derived variables (ex. noaa_heat_index_derived or rh_derived, noted by the “_derived” suffix) are not listed in the Analytics Engine Data Catalog because they are actually calculated “on the fly” within a notebook on the Analytics Engine JupyterHub. This means that derived variables are calculated when they are requested, but are not available otherwise. Derived variables can be generated using the Interactive Data Access and Visualization notebook (the notebook code is open source, so an Analytics Engine login isn’t required).
How does the data handle leap years?
GCMs come in a variety of calendars for handling the time dimension: including “fixed 365 day” (no leap days), “proleptic Gregorian” (leap days), or even “fixed 360 day” (every month has 30 days)! Depending on your analysis, you may wish to either keep or remove leap days for consistency with best practices. For example, in bias adjustment localization, leap days should be removed.
In the WRF models:
- No leap days: CESM2, FGOALS-g3, TaiESM1
- Leap days: EC-Earth3-Veg, CNRM-ESM2-1, EC-Earth3, MIROC6, and MPI-ESM1-2-HR
In the LOCA2-Hybrid models, all models were interpolated to include leap days if the parent GCM did not natively retain leap days. For more information on leap days in the LOCA2-Hybrid models, please see this blog post.
What part of the grid cell does the coordinate pair (latitude and longitude) represent?
For both georeferenced raster data, such as LOCA2-Hybrid data, and for WRF data, the coordinates represent the center point of the gridcell.
What do the u and v vector components of hourly wind speed represent?
The u- and v-vector components of wind describe the instantaneous wind speed for the west-east and north-south directions, respectively. The u- and v- vector winds are available for hourly WRF data. Using the vector components, the Analytics Engine team is able to derive wind magnitude (speed) and direction. For more information on each vector component:
- u10: x component of wind at 10m, “Wind coming from the left, measured at 10m above Earth’s surface. By convention, wind coming from the right is negative.”
- v10: y component of wind at 10m, “Wind coming from the bottom, measured at 10m above Earth’s surface. By convention, wind coming from the top is negative.”
FAQ Updates
FAQ, Version 2.0September 30, 2024
-
Removed questions related to clusters as the current codebase and notebooks do not use clusters at all
- How can I start up a dask cluster?
- How can I specify how many workers to use?
- Do I need to do anything special to my code to take advantage of the dask cluster?
- How can I close down the cluster when I am done?
-
Additional questions answered
- What is the Coordinate Reference System (CRS) for the WRF data?
- How can I access derived variables?
- How does the data handle leap years?
- What part of the grid cell does the coordinate pair (latitude and longitude) represent?
- What do the u and v vector components of hourly wind speed represent?
May 2, 2024
- Update “LOCA2” to “LOCA2-Hybrid”
FAQ, Version 1.1
August 15, 2023
-
Additional questions answered
- What data is available?
- Links updated
FAQ, Version 1.0
July 13, 2023
-
General questions
- What is JupyterHub?
- Who can use this service?
- What is JupyterLab?
- What packages and libraries are available?
- Can I use Analytics Engine with my own organization’s cloud?
- Can I request a dataset to add to Analytics Engine?
-
Technical questions
- When I run ckg.Select(), nothing is displayed. What should I do?
- What is dask?
- How can I start up a dask cluster?
- How can I specify how many workers to use?
- Do I need to do anything special to my code to take advantage of the dask cluster?
- How can I close down the cluster when I am done?
- I am confident with coding in python. How can I access the data catalog directly?
- How can I download the climate data used in the Analytics Engine?