AE Guidance
Overview of Heat Metrics for Energy Sector Planning
Background
Understanding how increasing temperatures affect asset performance and simultaneously drive demand for gas and electricity are essential parts of planning in the energy sector. Temperature alone is often not enough to capture the complex relationship between weather conditions, human comfort, and heating and cooling demand. A variety of heat metrics are used to better quantify these relationships, build reliable forecasts of energy demand from meteorological conditions, and enable climate-informed planning for energy sector assets. The Cal-Adapt Analytics Engine offers built-in functionality for many of the most common heat metrics, and the flexibility for planners to customize or implement their own. Here we explain key differences between heat metrics and direct users to relevant tools and resources both within the Analytics Engine and externally to support their use in planning applications.
Heat Index
Overview of heat index
Heat index is a metric that combines air temperature and relative humidity to quantify the human-perceived temperature (Steadman 1979). It generally captures the fact that humans feel warmer in humid conditions, and uses a series of formulas and assumptions to quantify this effect. Because heat index is a better predictor of human comfort than temperature alone, it is a valuable tool for predicting energy demand for cooling on hot days. Heat index only uses temperature and humidity as inputs (not solar radiation or wind), and as such it is best used as an estimate of the apparent temperature in the shade. It is not useful for capturing wind-chill or other effects at low temperatures (NWS Heat Index Statistics).
Calculating heat index
The modern approach to calculating heat index relies on a multiple regression analysis developed by Rothfusz in 1990 to capture the complex relationship between temperature, humidity, and perceived temperature (NWS Heat Index Equation). The Cal-Adapt Analytics Engine utilized NOAA’s implementation of the Rothfusz regression formulas for heat index, which uses additional adjustments for days with particularly high or low relative humidity (Analytics Engine Heat Index Applications Notebook). Because these heat index formulas are only well defined for days above 80 °F, the Cal-Adapt calculation returns the original temperature below this threshold.
For days that do not need an additional correction, the heat index is calculated as:
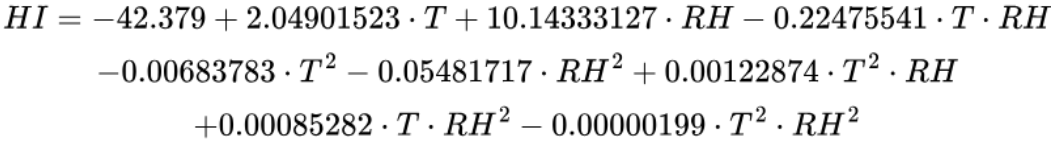
Where T is air temperature and RH is relative humidity.
Note: “NOAA Heat Index” is available as a derived variable in the Analytics Engine data catalog, with an example notebook to demonstrate its usage.
Wet Bulb Globe Temperature
Overview of wet bulb globe temperature
Wet bulb globe temperature (WBGT) is a metric that estimates heat stress in direct sunlight by using measurements of temperature, humidity, wind speed, and solar radiation (Budd 2007). It is used extensively as a measurement of heat hazards for humans, particularly for outdoor workers (OSHA Technical Manual). The use of several meteorological variables allows it to capture a variety of effects that influence the physiological response to high temperatures, but it has limited utility in cold temperatures. Similar to heat index, WBGT is a useful metric for connecting meteorological conditions to energy demand from cooling.
Calculating wet bulb globe temperature
Wet bulb globe temperature was originally formulated to utilize physical measurement devices that take a reading of wet-bulb temperature, dry-bulb temperature, and globe temperature. However, methods have been developed to compute WBGT from meteorological data from weather stations or climate models (Liljegren et al. 2008) (Dimiceli & Piltz).
Note: Wet Bulb Globe Temperature is not currently implemented as a pre-defined metric on the Cal-Adapt Analytics Engine, but it can be derived from variables in the Analytics Engine data catalog using either the method from Liljegren et al. (2008) or the NWS’s Dimiceli-Piltz algorithm.
Effective Temperature
Overview of effective temperature
Effective temperature is a heat metric that captures the cumulative effects from several days of temperature measurements. It uses a weighted sum of temperature measurements from the current day and some number of previous days (Elexon BSC Glossary). This makes it a useful metric in the energy sector for capturing how heat retention in buildings can impact demand for heating or cooling over subsequent days, and it has been used as a predictor of gas consumption under various formulations (National Grid Gas Demand Forecasting Methodology July 2020).
Calculating effective temperature
Effective temperature is calculated as a weighted sum of temperature across some number of consecutive days, but the specific number of days and their respective weights can vary based on the specific application. Within the energy sector, Elexon uses a three-day formula with a weight of 0.57 for today’s temperature, 0.28 for the prior day, and 0.15 for the day before that (Elexon BSC Guidance Notes). National Gas uses a recursive formulation, with the effective temperature defined as 50% of the current day’s actual temperature and 50% of the previous day’s effective temperature. Other formulas are used by utilities and energy planners based on their specific regions and applications (Azari et al. 2012) (Ashouri 1993). Cal-Adapt Analytics Engine uses a formulation of effective temperature based on the National Gas weighting scheme, with a four-day range (climakitae Indices). This version represents an industry standard with a proven track record in gas demand forecasting.
The formula used by the Analytics Engine for effective temperature is:

Where T is daily average air temperature, and Teff is effective temperature, and the recursive formula uses four days of backwards looking temperature data.
Note: Effective temperature is available in the Cal-Adapt Analytics Engine data catalog as a pre-calculated derived variable. Other formulations of effective temperature can be calculated from daily or hourly temperature data from climate projections in the Analytics Engine data catalog.
Cooling and Heating Degree Days
Overview of cooling and heating degree days
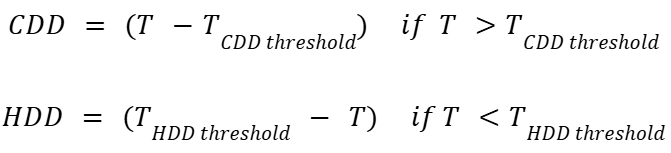
Cooling and heating degree days (CDDs and HDDs) are heat metrics based on the number of days above or below a specific temperature threshold, and by how many degrees the temperature exceeded that threshold. Degree days are designed to quantify how outdoor temperature drives demand for indoor heating and cooling (NWS Heating and Cooling Degree Days). These metrics have broad use throughout the energy sector for energy demand forecasting, establishing building standards, and prioritizing investments in improved heating and cooling technology (EIA Degree days). Rather than being a metric with one fixed definition, degree days are a flexible method that can be customized with thresholds and temperature metrics that suit a particular region or application.
Calculating HDDs and CDDs
For a given day, the number of degree days is calculated as the number of degrees that the day’s temperature is above (or below) a set threshold (NWS Heating and Cooling Degree Days). Degree days are always positive, and days that do not exceed the threshold are counted as zero degree days. The threshold is set based on an estimate of when heating or cooling of a building is needed. Thresholds can be different for heating and cooling degree days and/or vary based on the region or application. A standard threshold of 65 F is often used as a default. It is also possible to calculate CDDs or HDDs using a derived temperature metric like heat-index, wet bulb globe temperature, or other temperature metrics (Staffell et al. 2023).
Note: The Cal-Adapt Analytics Engine provides tools to calculate CDDs and HDDs from climate simulation data, including customizable temperature thresholds and a sample notebook to demonstrate their use.
Choosing the right heat metric for your application
There may be multiple heat metrics that are appropriate for use in different contexts, and/or combinations of them that are suited to a particular energy planning applications. Choosing the right metric and its formulation will depend on a user’s needs, and may require testing and numerical comparisons to determine which one performs best in a particular region and application. What follows are some general insights into the differences between each metric, and examples of the type of considerations that a user might walk through to choose between them.
Heat index and wet bulb globe temperature are both metrics with specific scientific definitions. Their formulas combine multiple meteorological variables to produce a perceived temperature that is relevant to humans and energy demand. They are both targeted specifically at understanding heat stress on high temperature days, and are useful for understanding extreme heat health risks and the need for shelter and active cooling.
Given their similarities, choosing between them may be based on:
- The need to specifically capture the effects of direct sun exposure that is included in WBGT, or the need for an estimate of shaded temperature that heat index provides.
- The availability of data, with heat index only requiring two commonly available variables.
- The need for consistency with other organizations, for example the NWS use of heat index in weather forecasts, or OSHA use of WBGT for occupational hazards.
In contrast, effective temperature and degree days are both customizable methods for combining temperature measurements over multiple days to estimate their impact on cooling and heating demand. These methods do not have a universal definition, and can be tailored to use a weighting scheme or threshold that matches a particular application. They are also both used in the context of understanding cooling demand on hot days as well as heating demand on cold days.
Effective temperature can be used as a replacement for daily temperature when examining the relationship between temperature and electricity demand. In this context, it can capture the lagged response of energy demand due to heat retention in buildings and cumulative heat stress for humans. The choice of a specific weighting scheme may depend on empirical data for this relationship in a particular region.
Degree days are more often used to summarize bulk demand for heating and cooling in a region on a monthly or annual basis, making them particularly well suited for summarizing long-term changes. The choice of threshold temperature for CDDs and HDDs has a large impact on the numerical results. When standardization and comparability of results to other sources is important, utilizing a standard 65°F threshold can be advantageous. When making more specific energy forecasting decisions, incorporating additional information about regional behavior or past data about the relationship between temperature and energy demand can be important for developing context-specific results.