Typical Meteorological Year 8760s
Overview
A typical meteorological year (TMY) profile is one year of hourly data that represents median meteorological conditions for a point location over a set amount of time (at least 15 years required). Cal-Adapt recommends and utilizes a 30-year period for TMY calculation, which adheres to compliance with global warming level (GWL) calculations.
A TMY profile is built from ten specific weather variables that are weighted based on TMY standards1,2. Median conditions are statistically determined for those variables and the most “typical” month is selected for each month during a year. “Typical” months are then compiled into a single climate profile. For example, the most “typical” January within the 30 year period could be from 2010, while the most “typical” February could be from 2022, and so on. The end result is an hourly climate profile for an entire year with each month spliced together from multiple input years. TMY profiles are widely used as critical inputs for energy modeling, simulating solar energy conversion systems, and evaluating building standards and energy efficiency1–3.
Applications
A TMY dataset is a specific kind of annualized hourly climate profile. They represent the most typical conditions for multiple variables during a designated climatological period and include the natural diurnal and seasonal variations that occur within a 1-year period1. Because TMYs are specifically developed for long-term planning of solar energy and to inform the design of buildings, the variables and weights that they use are therefore also specific to these applications.
Although TMYs may reduce simulation workload associated with evaluating every year of data for different variables4, misapplication of TMY data into planning processes can propagate misfitted assumptions about “median conditions” into risk assessments, infrastructure planning, and policy design.
Example appropriate applications of TMYs
Example inappropriate applications of TMY
- Extreme event analysis, including high-impact hazards such as extreme heat, cold spells, wildfire2,5,11 and power outages5 (see XMYs below for extreme event analysis)
- Capturing compounding and cascading events (see XMYs for extreme event analysis)
- Historical TMYs should not be used for future building design3,9,10 (see FTMYs below)
- Evaluation of actual system performance5
- Near-real time forecasting2
- Custom weighting of variables; although alternative approaches may be appropriate based on specific use cases (e.g., specific building applications)4
Common Acronyms & Shorthand for TMYs
- TMY: Typical Meteorological Year - A TMY that provides the median conditions. TMYs can be computed for historical periods of time (a Historical TMY) or a future period of time (a Future TMY). The TMYs generated on the Analytics Engine are model-based TMYs.
- Historical TMY - A TMY profile that provides median weather conditions for a historical period, which can be derived from historical observations or historical climate model data.
- FTMY: Future Typical Meteorological Year - A TMY that provides median weather conditions for a future period, which can only be derived from future climate model data.
- XMY: Extreme Typical Meteorological Year - A TMY that provides extreme weather conditions, either for a historical or future period, which can only be derived from model data. XMYs may also be referred to as “EMY”.
- AMY: Actual Meteorological Year - The observed historical weather conditions from a specific year, which is used as a comparison to the synthetically-generated composite TMY year.
Cal-Adapt previously had fuctionality to produce an “average meteorological year” for single-variable 8760s, which was also referred to as “AMY”. This terminology has been removed to avoid confusion with actual meteorological years.
Future TMYs
Future TMYs (FTMYs) incorporate future climate model data into a TMY framework using the same variables and weighting scheme. Given the multi-decadal lifespan of buildings and potential changes to energy system performance under climate conditions, FMTYs enable more forward-looking assessments of expected changes in their performance than TMYs constructed using historical data3,5,6,8,11–14.
Recommendations for FTMYs
- Carefully consider whether a global warming level or a time-based approach for calculating a FTMY, especially with regards to projected climatic change over several decades3,6. Cal-Adapt recommends TMYs calculated using a global warming levels approach which ensures consistency between future climate projections and reduces uncertainties resulting from the wide range of climate sensitivity in climate models.
- Select the location of interest as needed by the analysis, rather than relying on weather station locations. Historical observation-based TMYs are historically based on weather station locations which may be far away from urban areas and not accurately reflect the actual highly localized microclimatic environment, especially for phenomena such as the urban heat island effect9. Cal-Adapt TMYs and FTMYs can be calculated at any location within the WECC area, given latitude and longitude coordinates.
Working with TMY files
After generating model-based TMY files, users may ask what steps to take next. Cal-Adapt TMY files are kept model-independent (one profile per model). No further aggregation or downsampling is performed, as the appropriate approach depends on the user’s specific application and need for the TMY information. The following guidance is provided to support next steps in using these data.
When to evaluate the range of results
When the application requires an understanding of the range of future, or even extreme, options using a TMY data format, it is first recommended to evaluate whether a TMY, FTMY, or XMY is the most appropriate dataset to use. If a TMY or FTMY is needed, it is recommended to use a GWL-based TMY or FTMY, instead of a time-based climatological reference period. The GWL method reduces uncertainties between models and alleviates the hot model problem, so that the user can more directly compare model-based FTMYs at a specific planning horizon. From there, evaluate the differences between models and how they can inform the analysis. At this stage, users may elect to aggregate the FTMYs and conduct an uncertainty analysis across the results.
When to aggregate results
If an application requires a single TMY, users may elect to aggregate results. It is recommended to evaluate TMYs from all of the available models to understand where each falls in the spread of conditions as well as the need for physically consistent results.
- Multi-model median: A TMY itself is designed to capture median conditions, therefore calculating a multi-model median may be the most appropriate aggregation approach. A multi-model median is recommended over a multi-model mean, because the mean is sensitive to outliers (extreme values) whereas a median is not, even with a “typical” TMY. Different considerations should be made for XMYs.
- Multi-model range: Consider calculating the multi-model difference for each hour between the “max” and “min” model spread of conditions as a measure of uncertainty in addition to the multi-model median.
When to select a single model
If an aggregated TMY (e.g., multi-model median) is not appropriate or desired (e.g. when it is necessary to retain a single model’s synthetic record rather than aggregate), users may elect to select a TMY from a single model. It is recommended that users first evaluate all of the available models to understand where each falls in the spread of “median” conditions. Additionally, it is strongly recommended that users document which model was selected and why.
- Selecting the median model: A TMY itself is designed to capture median conditions, therefore the median model may be the most appropriate selection.
- Selecting any model: If the range between models is very small, or not critical for the application or location, any model can serve as a representation of the ensemble.
When to weight results
Weighting may be appropriate for the user’s application if the user needs to consider multiple locations in their analysis using TMY data. For example, weighting TMY profiles for a gridded area assessment is a common application, especially in adhering to building standards. Weighting options may include:
- Population weighting: for building capacity, or in comparison across different locations
- Location-based weighting: if your area of interest falls between several different weather stations
- Load weighting: for generation and demand forecasting capacity across a service territory
- Building design weighting: for comparison amongst different building types (e.g., commercial vs. residential)
Methodology
Step 1: User selects location of interest and timeframe of interest (Historical TMY or Future TMY)
Cal-Adapt historical or future TMYs (FTMY) are currently for point-based locations, meaning that a user will first select a specific location of interest (e.g., a power plant or an airport weather station). At this point, the user will also select a period of time, such as a historical period or future planning horizon. At least 15 years of daily data is required; Cal-Adapt uses a default 30-year period in line with best-practices for climate data. Cal-Adapt TMYs can be generated either via global warming level or time-based periods.
Step 2: Data is retrieved
The input data for determining a “typical” month is retrieved for that location, which includes the following variables:
- Mean air temperature
- Min air temperature
- Max air temperature
- Mean dew point temperature
- Min dew point temperature
- Max dew point temperature
- Mean wind speed
- Max wind speed
- Global irradiance
- Direct irradiance
It is important to note that only 4 bias-adjusted WRF Cal-Adapt downscaled models have all of the required variables to calculate a TMY profile – specifically, the two solar variables. Cal-Adapt TMYs therefore only include the appropriate models. The last step in the data retrieval process is to ensure that all of the input data is in the local time zone for the location of interest. Because the input data is in UTC, the minimum temperature in hourly data “appears” on the day before (i.e., midnight on Monday in UTC corresponds to 5pm PST on Sunday). Converting to the local timezone is important to ensure that the daily minimum occurs on the correct day.
Step 3: Calculate the long-term climatological distribution
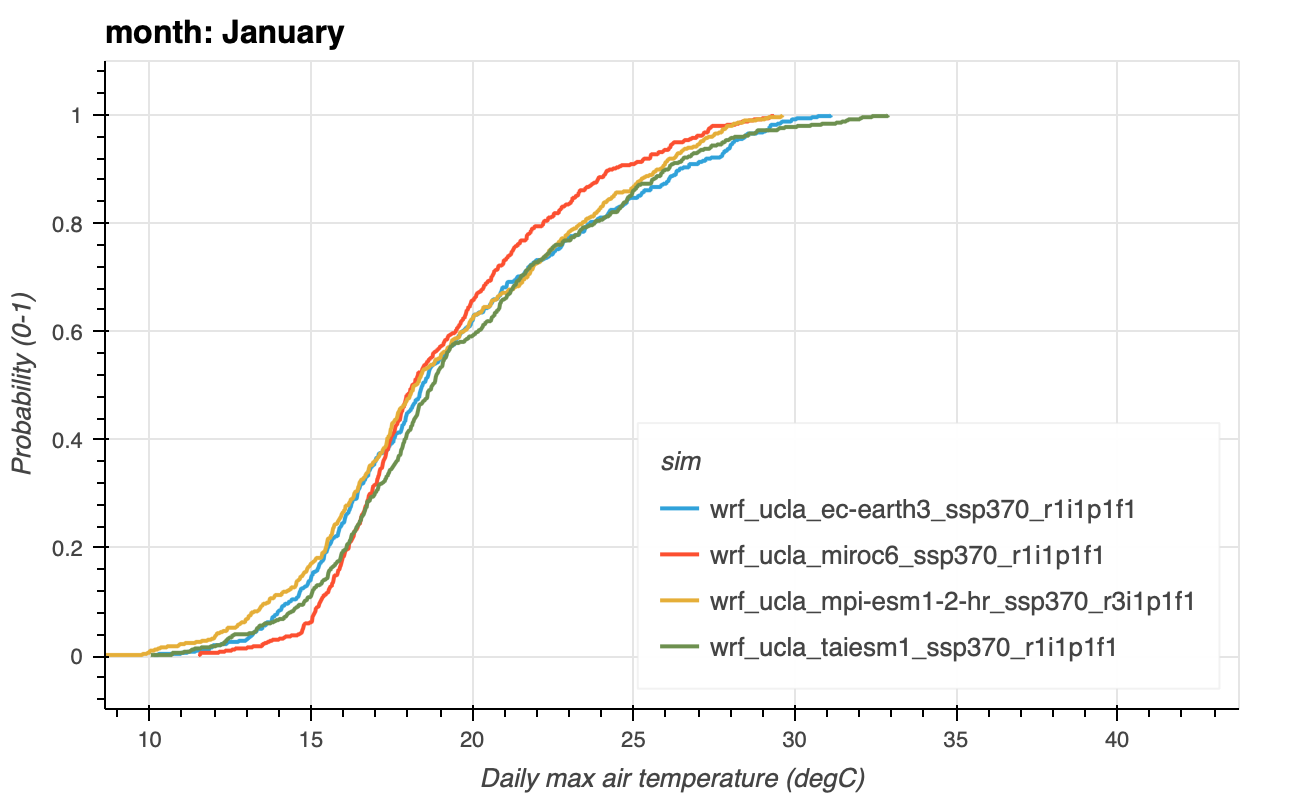
The TMY method specifically uses a cumulative distribution function (CDF), which calculates the 30-year climatological distribution for each variable. This distribution is used as a baseline to determine which specific month within the 30-year period is closest to this baseline condition, and is repeated for all months (i.e., climatologically typical January, climatologically typical February, etc.).
Step 4: Calculate the per-year per-month distribution
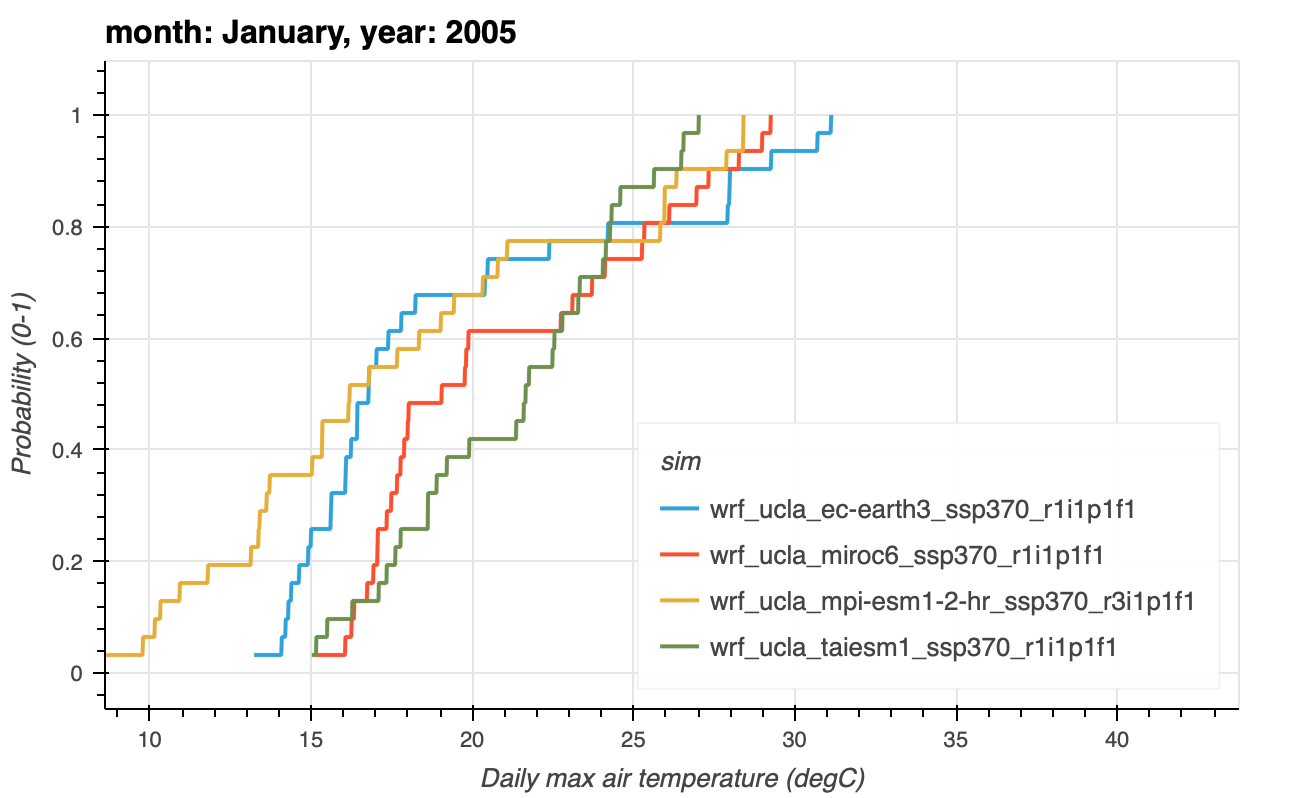
Next, the CDF for each month of each year is calculated (i.e., January 2001, January 2002, and so on). This process is repeated for all variables. Following TMY convention, specific months are removed from consideration if they occurred during major volcanic eruptions like Pinatubo (June 1991 to December 1994), because volcanic aerosols have a major cooling impact on solar variables.
Step 5: Identify the month closest to climatology
The long-term climatological distribution (Step 3) is then compared to the monthly distribution (Step 4) for each variable. The closest individual month to the climatology is determined by a Finkelstein-Schafer (F-S) statistic15, which describes the absolute difference between the climatological distribution and each candidate month’s distribution profile.
Step 6: Weight the input variables
The results from the F-S statistic (Step 5) are then weighted based on the input variables. The Analytics Engine uses the NSRDB weighting scheme1,2, which places higher weight on the solar variables due to their use in building and solar renewables applications:
- Mean air temperature: 2/20, or 10%
- Min air temperature: 1/20, or 5%
- Max air temperature: 1/20, or 5%
- Mean dew point temperature: 2/20, or 10%
- Min dew point temperature: 1/20, or 5%
- Max dew point temperature: 1/20, or 5%
- Mean wind speed: 1/20, or 5%
- Max wind speed: 1/20, or 5%
- Global irradiance: 5/20, or 25%
- Direct irradiance: 5/20, or 25%
Since the TMY methodology heavily weights the solar radiation input data, be aware that the final selection of “typical” months may not be typical for the non-solar radiation variables. In other words, what is selected as a typical June is based on the heavily weighted solar radiation conditions. That same month may not equally represent typical median June air temperatures.
The ISO 15927-4 method16 for calculating TMYs utilizes a different weighting scheme, instead prioritizing air temperature, relative humidity, solar radiation, and wind speed.
Step 7: Select candidate month for each month of the year
Once weighted, the month with the lowest weighted sum is selected, meaning that the candidate month is the closest or most “typical” to the long-term climatology for that specific month. This process is repeated for all months, per model. Cal-Adapt TMYs ensure that model data is kept intact, meaning that the most typical month is selected from the same model, not across models (e.g., not: January from MIROC6 and February from EC-Earth3), which would introduce model uncertainty. The end result of this process is a TMY profile generated for each model. This provides a great opportunity to be able to do multi-model comparisons of TMY profiles in a physically consistent space.
Step 8: Generate the TMY 8760 profile
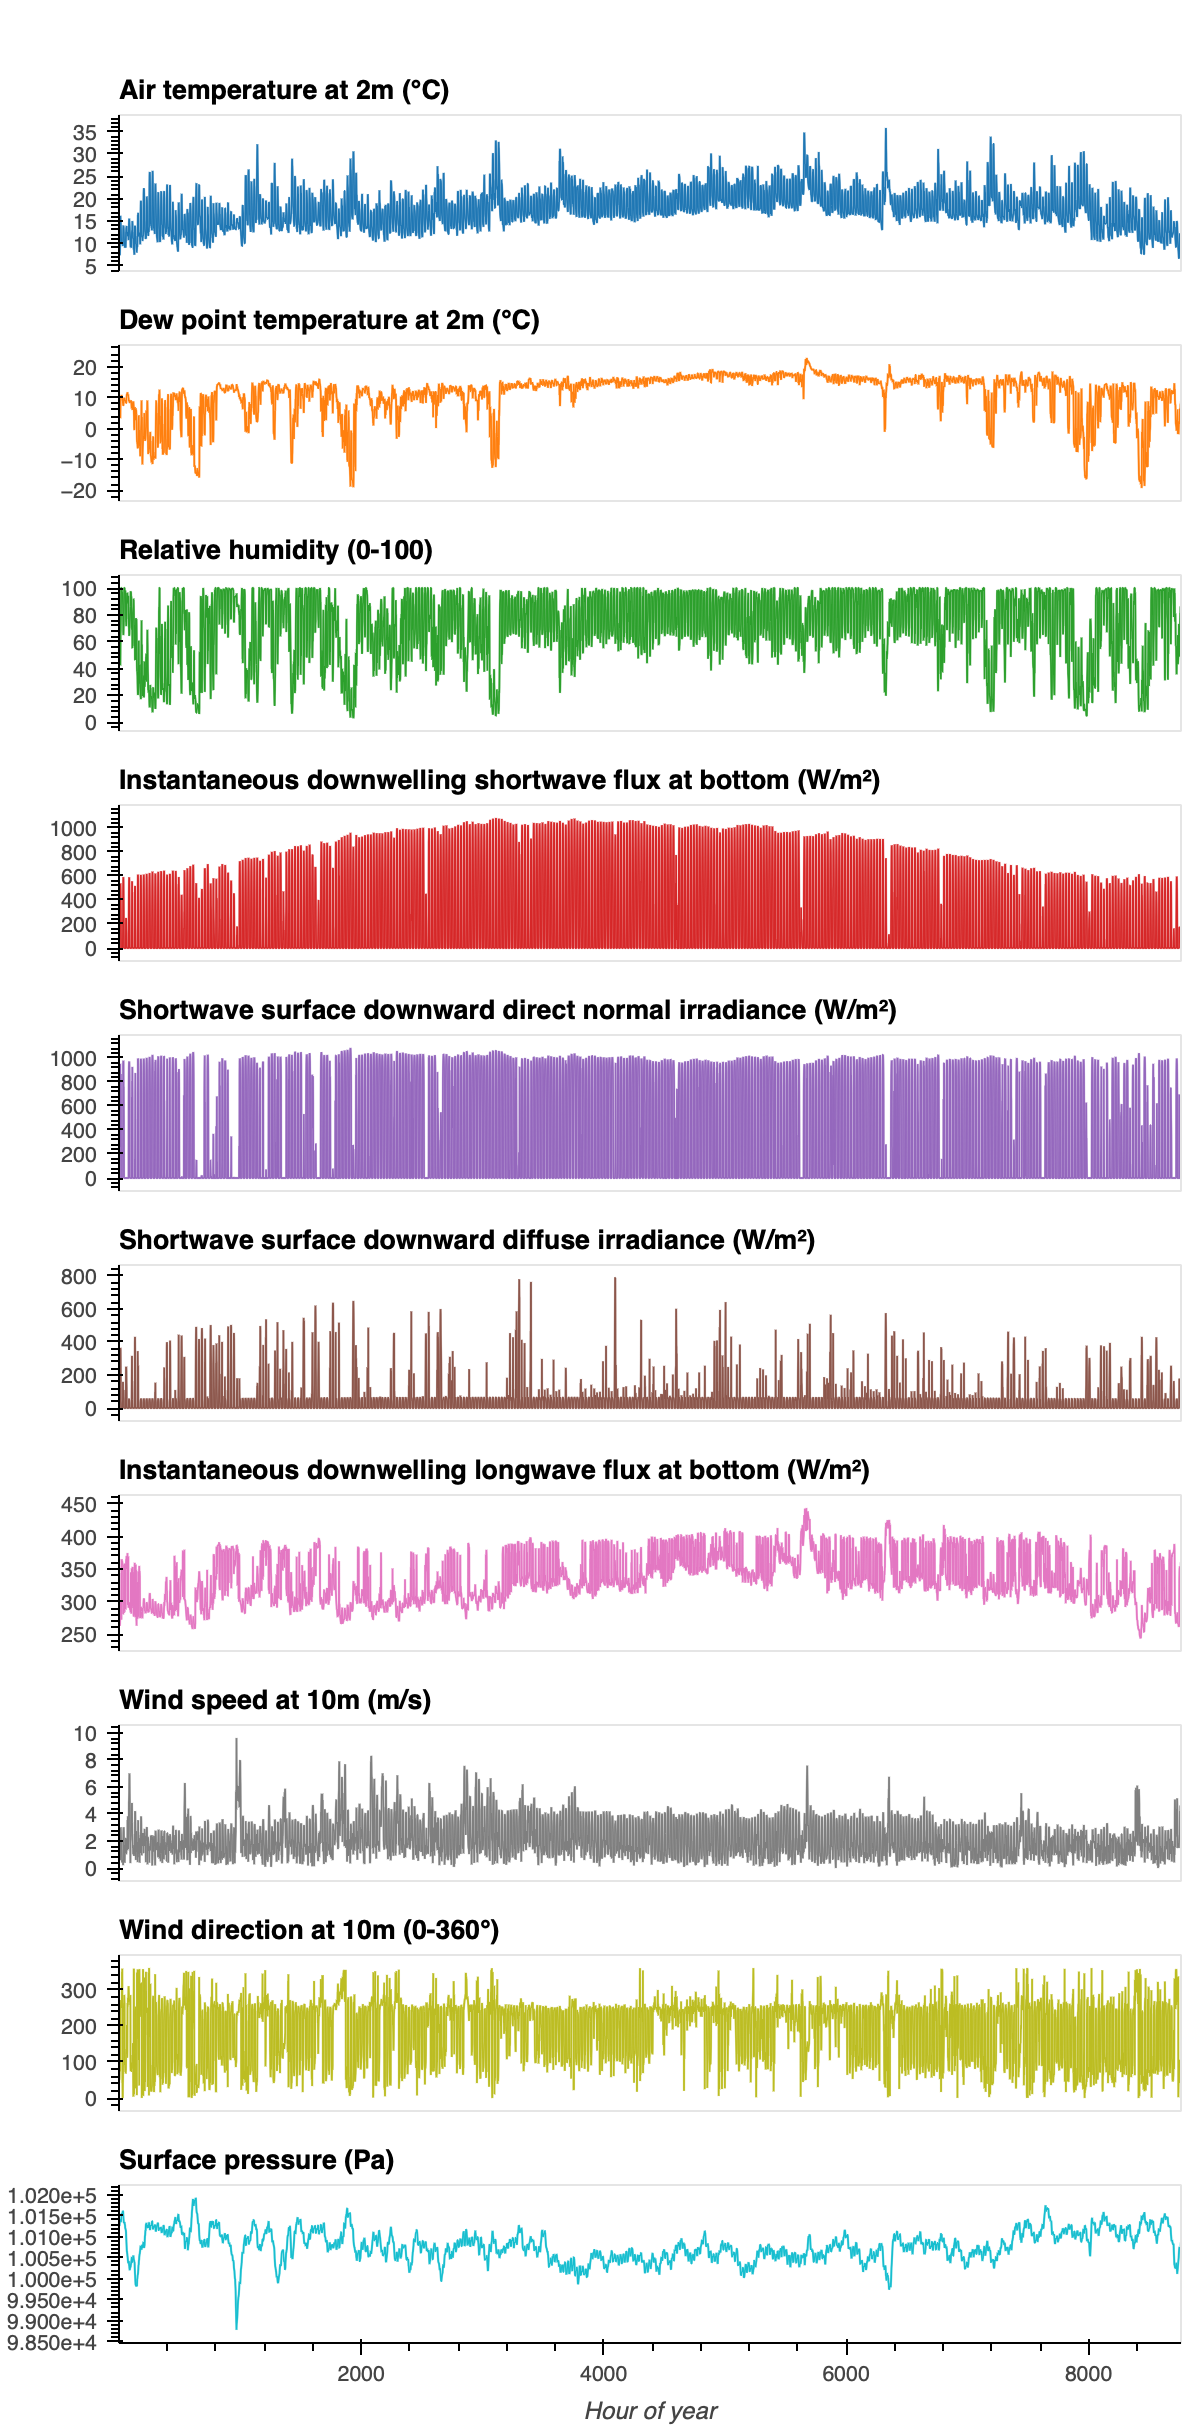
Once the “typical” months are selected for the entire year, a TMY profile is generated for the full hourly information. A TMY profile includes information on: air temperature, dewpoint temperature, relative humidity, global irradiance, direct irradiance, diffuse irradiance, downwelling radiation, wind speed and direction, and surface air pressure, for each of the specific months determined by Step 7 for all four models.
Smoothing at the monthly interface between months is performed via curve fit to prevent discontinuities between months2. TMY profiles are provided in several formats, based on the user’s needs: .epw17, .csv, and .tmy2. Custom TMY profiles take approximately 40 minutes to generate on the Cal-Adapt: Analytics Engine.